Ask five different traders to define MSS and CISD, and you will likely get five slightly different answers. Part of the confusion is that both terms point at the same underlying idea — price used to be heading one way, and now it isn’t. But the two signals are built from entirely different parts of a chart, and one almost always shows up before the other.
This SMC guide explores exactly what separates them, why the timing gap exists, and how to put both to practical use.

What the MSS Actually Explains?
MSS stands for Market Structure Shift. The concept depends entirely on swing points — the visible highs and lows a chart leaves behind as price moves.
Imagine a market steadily printing bullish candlesticks, each pullback bottoming out higher than the pullback before it. That’s a normal uptrend, defined by a string of rising lows. An MSS happens the moment one of those rising lows finally gets broken — price trades below the most recent low instead of holding above it. That single break tells you the short-term structure has shifted, and the market may now be leaning bearish rather than bullish.
The mechanics matter here. MSS cares about the extremes of a candle — its high and its low — because a swing point is, by definition, the highest or lowest price reached during a specific stretch of trading. Whether the candle’s close ended up near the top or the bottom of its range is beside the point for MSS. What matters is whether price traveled far enough to actually breach that earlier extreme.
This is also why MSS tends to sit closer to how most price action traders were originally taught to read a chart, long before terms like CISD entered the conversation. Marking swing highs and swing lows, watching for one of them to break, and reading that break as evidence of a shifting trend is a fairly old habit in technical analysis.
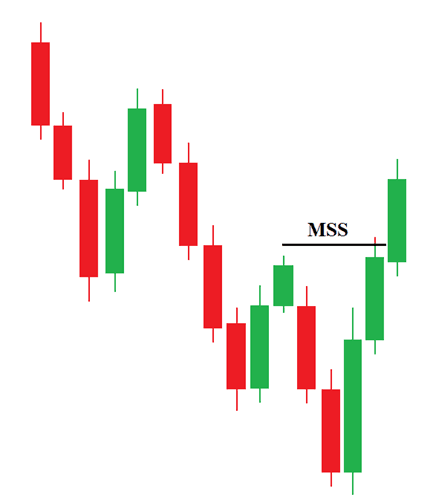
MSS gives that old habit a specific ICT-flavored name, but the underlying skill — spotting when a rising pattern of lows or a falling pattern of highs finally gives way — is the same one traders have practiced for decades.

What CISD Covers?
CISD stands for Change in State of Delivery, and it works from a completely different set of numbers: the open and close of each candle, not the high and low.
To spot one, look at a short sequence of candles all moving the same direction — a handful of bullish candles pushing higher, for example. A CISD forms when a later candle closes back below the opening price of the very first candle in that bullish run. That close is read as a sign the buying pressure has broken down, even before price has traveled anywhere near a real swing point.
The detail that trips up a lot of newer traders: a wick reaching below that opening level does not count. The candle has to actually close there. Anything less is treated as noise, not a signal.
What is the Difference between MSS and CISD?
MSS is measured using a candle’s high and low. CISD is measured using a candle’s open and close. That single distinction explains almost every other difference between the two.
A swing point, the thing MSS depends on, can only be broken once price has actually traveled to that exact extreme and gone beyond it. A CISD level, by contrast, sits much closer to where price currently is, because it’s anchored to a recent candle’s opening price rather than a further-away high or low. Reaching a nearby level obviously takes less movement than reaching a distant one.
Why does CISD Occurs first?
Because of that distance difference, CISD almost always shows up before MSS does. Price only needs to travel back through a recent open to trigger a CISD. It needs to travel much further to trigger an MSS.
Some traders describe this relationship simply: CISD is the early warning, and MSS is the later confirmation. By the time MSS actually fires, a CISD in the same direction has usually already formed several candles earlier. Neither one is “wrong” for showing up when it does. They are just measuring different distances on the same chart.
Side-by-Side Comparison
| Feature | MSS | CISD |
| Based on | Candle highs and lows | Candle opens and closes |
| Requires | A break of an actual swing point | A close beyond a recent candle’s open |
| Speed | Slower — needs more price travel | Faster — often fires early |
| Distance from current price | Farther away | Closer, more immediate |
| Typical role | Confirms a structural shift | Flags an early shift in pressure |
How Traders Combine MSS and CISD?
A practical routine many ICT-style traders follow looks something like this. Use MSS as the big-picture read — the signal that tells you structure has genuinely shifted, worth paying attention to on a higher timeframe. Then, rather than entering the instant that MSS confirms, drop to a lower timeframe and look for a CISD forming in the same direction as an entry trigger.
One trader described it well: think of MSS as the wide-angle photo and CISD as the zoomed-in detail. The wide-angle shot tells you something important has changed. The zoomed-in detail tells you exactly where, inside that bigger picture, to actually place your trade. Using CISD as an entry technique nested inside a move that MSS has already validated tends to produce a tighter stop and a cleaner risk-to-reward setup than either signal used completely alone.
Common Mistakes to Avoid
- Reacting to a wick instead of a close. This mistake shows up constantly. Only a full candle close counts for CISD. A brief touch below an opening price and then a bounce back up is not a signal — it’s just noise.
- Treating CISD as a standalone strategy. A CISD with no broader context is just one candle closing a certain way. It becomes far more useful once it’s read alongside a clear directional bias, ideally one that an eventual MSS is likely to confirm.
- Waiting too long for MSS. Because MSS requires an actual swing point to break, holding out for it exclusively means missing the earlier, often tighter opportunities that CISD already flagged several candles before.
- Assuming every MSS holds permanently. A broken swing point is a meaningful event, but markets do sometimes reclaim that level and continue the original trend. Some confirmation beyond the break itself helps filter out the breaks that fail.
- Using both signals in isolation from higher timeframes. Even a genuine MSS on a five-minute chart can mean very little if the daily or four-hour chart is still firmly trending the opposite way. The lower timeframe structure shift is real, but it may only represent a temporary pullback inside a much larger, still-intact trend. Checking a higher timeframe before treating either signal as a full reversal saves a lot of traders from fighting a much bigger, stronger move.
Final Note
MSS and CISD are answering a similar question from two different distances. MSS needs price to travel far enough to break an actual swing high or low, which makes it slower but generally more dependable once it happens. CISD only needs a candle to close back past a recent opening price, which makes it faster but noisier on its own.
Used together — MSS for the broader directional read, CISD for a tighter, earlier entry inside that same direction — they cover each other’s weak points. Learning to tell them apart at a glance is a small skill that pays off every time a chart starts to turn.

I’m Abdullah Shah, a content writer with three years of experience in crafting engaging and informative content. My background in market analysis complements my work, allowing me to create content that resonates with audiences. I’m also a seasoned practitioner in the forex and crypto markets, with a strong foundation and deep interest in finance. My passion for the financial world drives me to produce content that is both insightful and valuable for those interested in understanding market trends and financial strategies.