Table of Contents
As we know that candlestick patterns are repetitive in nature. Just like hammer pattern, its inverse is also important in downtrend market. Inverted Hammer pattern is easy to identify on the chart. In market analysis, trader’s ultimate goal is to filter the trading signals and finding the reliable one. This can be done by employing various factors that can be used along with inverted hammer pattern. This article helps in this matter. This article explores its structure & formation, market psychology behind inverted hammer, and key factors to consider while analyzing the market.
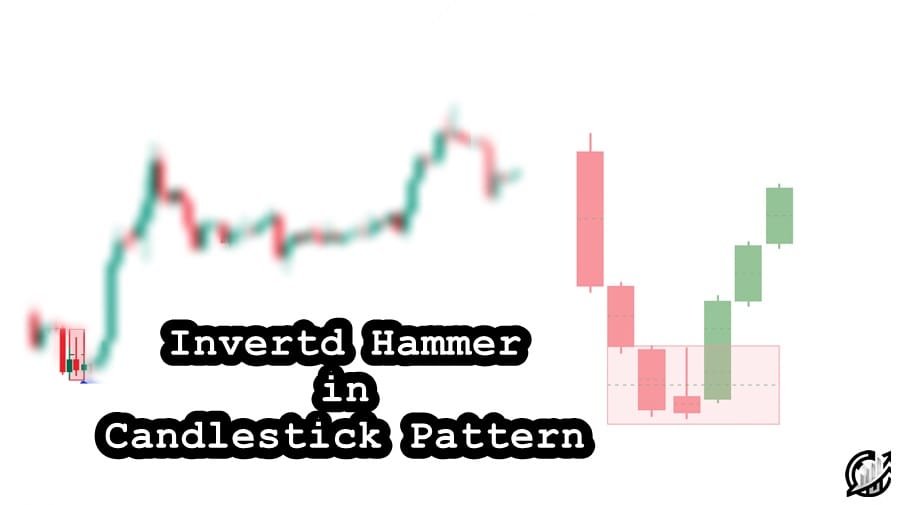
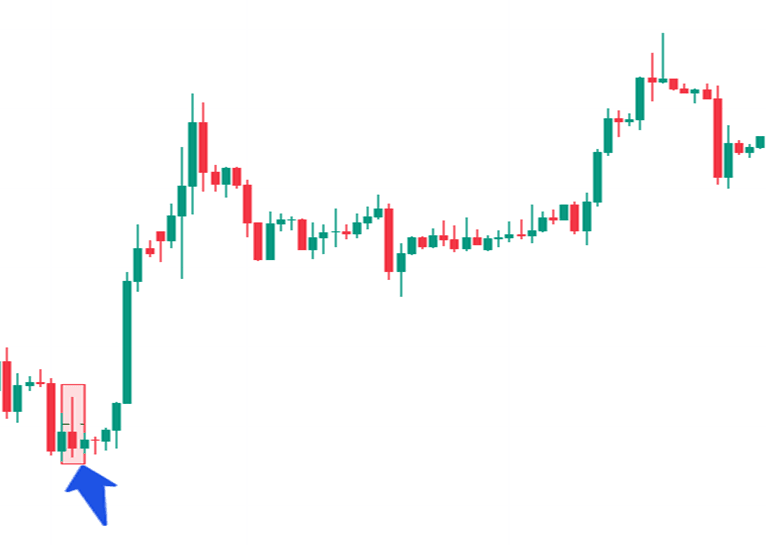
Inverted Hammer Candlestick
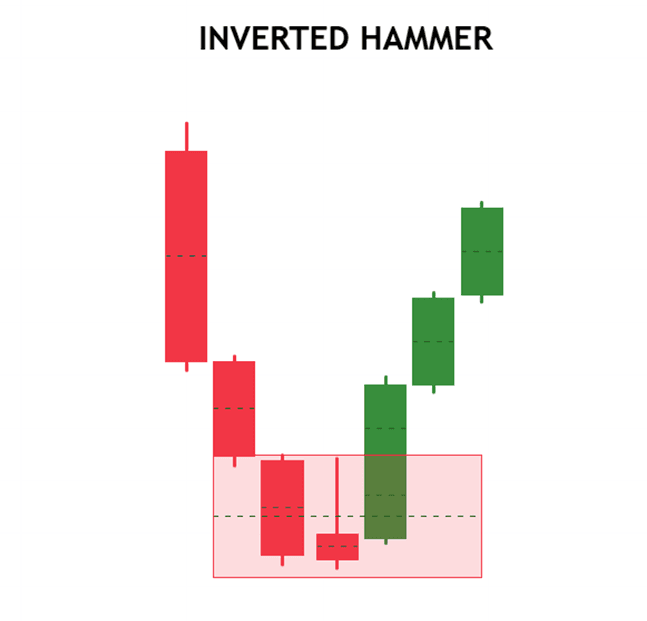
Inverted hammer is a Japanese candlestick pattern used in chart analysis. Inverted hammer is single candlestick formation that signals a potential bullish reversal in a market. It usually appears after a strong downtrend and suggest that the momentum maybe shifting from seller to buyers.
Inverted hammer candlesticks are often spotted on chart but not all of them are reliable. It must be confirmed by employing various other technical aspects of the market. Trend reversal from downtrend to uptrend require well-established accumulation phase. Institutions accumulate before taking market higher. It can be confirmed if it is near demand zone and RSI suggesting oversold zone.
Apart from trend reversal prediction, it can be a sign of a stop of downtrend. Remember, inverted hammer candlestick alone is not a powerful sign of trend reversal. It must be confirmed. It is not necessary to reverse the trend. Most of the time, inverted can serve as a temporary stop of a previous trend.
Structure and formation of Inverted hammer pattern
Structure of the candlestick is so simple that it can be seen everywhere on chart. The following candle structure can be seen easily on chart:
- The candle is the same like shooting star but it appears in downtrend. Body of the candle is small and located near the low of the session. The bullish or bearish nature of the candle is less significant in the overall structure.
- The upper shadow of the candle is the second most defining feature of inverted hammer. The upper shadow (wick) is long at least twice the length of the body. Wick represents the highest point reached during the session.
- Lower shadow of the candle is very small or nonexistent.
Inverted hammer can be easily spotted on chart but the context of the market is important in order to label the candle as “Inverted Hammer”. So, it is important to consider market context before taking any decision.
Finding reliable inverted hammer is a challenging task. Not every Formation of the candle is considered as reliable one. The Reliable formation of inverted hammer takes place in the following way:
- The market must be in a downtrend, and the prior trend must be weak and in oversold zone. The inverted hammer appears at or near the end of the trend.
- The structure of the inverted hammer remains the same. The candle opens at or near the previous close and begins to move higher. It shows interest of buyer to change the trend.
- As the price reaches higher level, selling pressure increases once again. Sellers step in, driving the price back down towards the opening level. The strong buying pressure result in longer upper wick.
- Inverted hammer closes near or slightly above the opening price, leaving a small body and a longer upper wick. The small body indicates that the opening and closing prices were close to each other.
- The next candle is the most important to Inverted hammer. If a strong bullish candlestick appears, it would be considered as optimistic for buyers and pessimistic for sellers.
Understanding the structure and formation of the Inverted Hammer can help traders identify potential trend reversals and make more informed trading decisions.
Psychology behind Inverted hammer
Psychology behind Inverted hammer candlestick pattern reflects the shifting dynamics between buyers and seller in the market. If there is a proper context analysis, entails the following psychological aspects:
- Before the formation of shooting star pattern, the market is trending down. Traders are pessimistic about the price and it is clear picture of bearish sentiment. During the period, traders expect prices to continue falling, reinforcing the downtrend.
- There the formation of the inverted hammer occurs. The session opens near the low of the day, continuing the downtrend’s momentum. Sellers initially feel confident that the downtrend will persist.
- As the session continue, buyers begin to enter in the market. This could be due to perceived value or short-covering. The buying pressure pushes the price higher, well above the opening price.
- Despite the buying pressure, sellers are not entirely out of the game. They push back the price towards the opening level by the end of the session. This results in small real body, longer upper shadow, and small or no lower shadow.
- In general, the formation of the inverted hammer reflects indecision in the market. While sellers managed to regain some control by the close, the fact that buyers were able to push the price up significantly shows that the bearish momentum may be weakening.
- The Inverted Hammer signals to traders that the downtrend could be losing steam. The long upper shadow suggests that there is buying interest at these lower levels, which could lead to a reversal if buying pressure continues.
- For traders, the appearance of an Inverted Hammer can trigger a psychological shift. Bears might begin to lose confidence, especially if a bullish confirmation candle follows in the next session. Bulls, on the other hand, may see this as an opportunity to enter the market or add to their positions.
It is confirmed with the upcoming candle (Strong bullish candle). The pattern highlights the growing uncertainty among bears and the increasing confidence among bulls, making it a key signal for potential changes in market direction.
Key consideration
When analyzing the inverted hammer candlestick pattern, there are several factors that should be considered in the market. The following are the factors that help and filter for us the potential signals:
- Trend preceding Inverted hammer candlestick. The preceding trend be downtrend. Inverted hammer appears after a well-established downtrend. The strength of the trend can impact the pattern’s reliability. Assess the overall health of the trend. It would be better if sellers are getting exhausted and the market in oversold zone.
- Inverted hammer is confirmed with next session strong bullish candle. A single inverted hammer candlestick does not guarantee a reversal. The confirmation in the form of strong bullish candle strengthens the reversal signal.
- Volume during the formation of the Inverted Hammer can provide insights. If the pattern forms with high volume, it suggests significant buying interest, making the pattern more reliable. Compare the volume on the day of the Inverted Hammer with the volume on previous downtrend days. A noticeable increase might indicate a shift in market sentiment. A high volume on bullish confirmation candle confirms the change of interest.
- Look for the demand zone. Inverted hammer near old demand zone reinforces the likelihood of a reversal. Demand zones attracts buyers making a reversal more probable.
- Consider broader market conditions. For example, if the broader market is in an uptrend, an Inverted Hammer in a specific asset could be more reliable. In contrast, in a bearish market, the pattern might be less effective.
- The Inverted Hammer pattern can appear on Multiple time frames (e.g., daily, weekly, hourly). The reliability of the pattern often increases with longer time frames, such as daily or weekly charts, compared to shorter ones like hourly charts.
By considering these factors alongside the Inverted Hammer pattern, traders and analysts can make more informed decisions and increase the likelihood of successful trades or accurate market predictions.
Concluding Remarks
The Inverted Hammer candlestick pattern is a valuable tool for identifying potential reversals in downtrends. However, it should not be relied upon in isolation. Traders should consider confirmation from subsequent bullish candles, volume analysis, and the broader market context. Incorporating additional factors such as support and resistance levels, trend strength, and complementary technical indicators enhances the pattern’s reliability. By combining these elements, the Inverted Hammer can be a powerful component of a well-rounded trading strategy, aiding in more informed and successful decision-making.
Frequently Asked Questions (FAQs)
What is an Inverted Hammer candlestick pattern?
The Inverted Hammer is a single candlestick pattern that appears after a downtrend and signals a potential reversal. It has a small real body, a long upper shadow, and little to no lower shadow.
How does the Inverted Hammer differ from a regular Hammer pattern?
While both patterns signal potential reversals, the Inverted Hammer has a long upper shadow and small lower body, resembling an upside-down hammer. A regular Hammer has a long lower shadow and small upper body.
Can the Inverted Hammer appear in an uptrend?
If it appears in an uptrend, it’s called a Shooting Star, which signals a potential bearish reversal. The Inverted Hammer specifically signals a bullish reversal after a downtrend.
What confirmation is needed after an Inverted Hammer?
Traders typically look for a bullish candle in the next session that closes above the Inverted Hammer’s close to confirm the reversal.
I’m Abdullah Shah, a content writer with three years of experience in crafting engaging and informative content. My background in market analysis complements my work, allowing me to create content that resonates with audiences. I’m also a seasoned practitioner in the forex and crypto markets, with a strong foundation and deep interest in finance. My passion for the financial world drives me to produce content that is both insightful and valuable for those interested in understanding market trends and financial strategies.