There’s a particular kind of candle that shows up right when a rally starts feeling unstoppable — price pushes to a fresh high, momentum looks strong, and then, almost as quickly as it climbed, it gets slammed back down before the close. That dramatic rejection, captured in a single candle, is the shooting star, and it’s one of the more visually striking warning signs in candlestick trading.
“The shooting star doesn’t fade quietly. It gets shot down in front of everyone watching.”
In this guide, we’ll break down what the shooting star pattern actually represents, why its shape matters so much, how it compares to the inverted hammer, and how to trade it responsibly — all explained in plain, beginner-friendly language.
What Is a Shooting Star Candlestick Pattern?
A shooting star has three defining features:
- A small body positioned near the bottom of the candle’s overall range
- A long upper wick, generally at least twice the length of the body
- Little to no lower wick
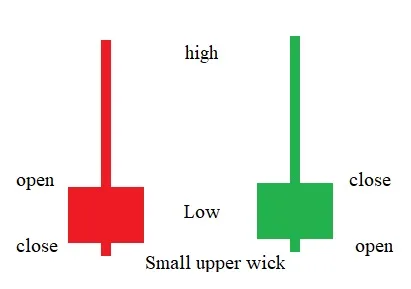
This shape typically appears after an uptrend, representing a session where buyers initially pushed price sharply higher, only for sellers to step in aggressively and drag it almost all the way back down to the open by the close.
“The long upper wick is the giveaway. It shows exactly how high buyers reached — and exactly how hard sellers slammed the door shut.”
Why the Shooting Star Signals Weakness
Every part of a shooting star’s structure tells part of the story:
- The long upper wick shows buyers were initially strong enough to push price to new highs.
- The small body near the bottom shows sellers overwhelmed that strength before the candle closed.
- The lack of a lower wick shows sellers maintained control right through to the close, without buyers reclaiming any ground.
Together, this pattern suggests that a rally has reached a point where sellers are finally strong enough to reject further upside — often the first visible sign that an uptrend’s momentum is running out.
Where a Shooting Star Should Form to Be Reliable
Like most candlestick signals, context matters enormously. A shooting star carries far more weight when it appears:
- After a clear, extended uptrend rather than a minor, short-lived push higher
- At a previously tested resistance level, trendline, or significant round number
- Alongside noticeably elevated volume, suggesting genuine selling pressure rather than random noise
- Followed by a confirming bearish candle
A shooting star-shaped candle appearing in a quiet, sideways market — without a real uptrend behind it or resistance nearby — carries much less significance, even if it looks identical.
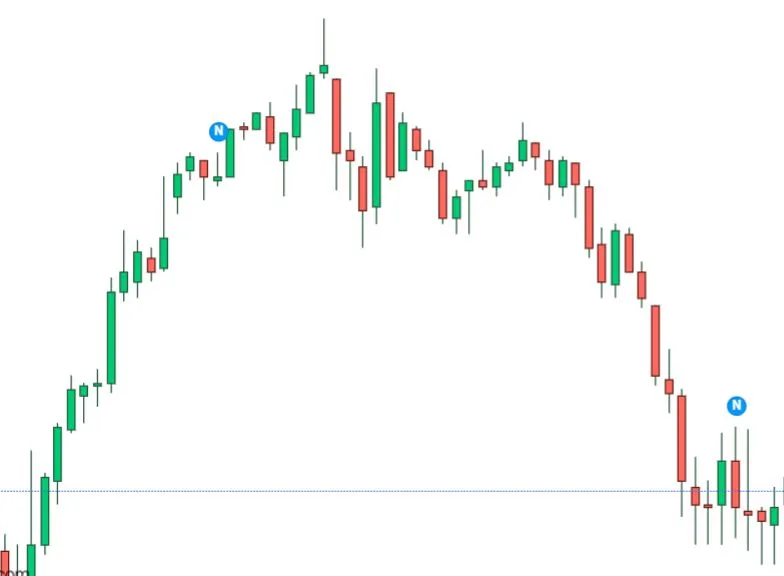
“The shape gets your attention. The location decides whether it deserves it.”
Shooting Star vs Inverted Hammer: Same Shape, Opposite Meaning
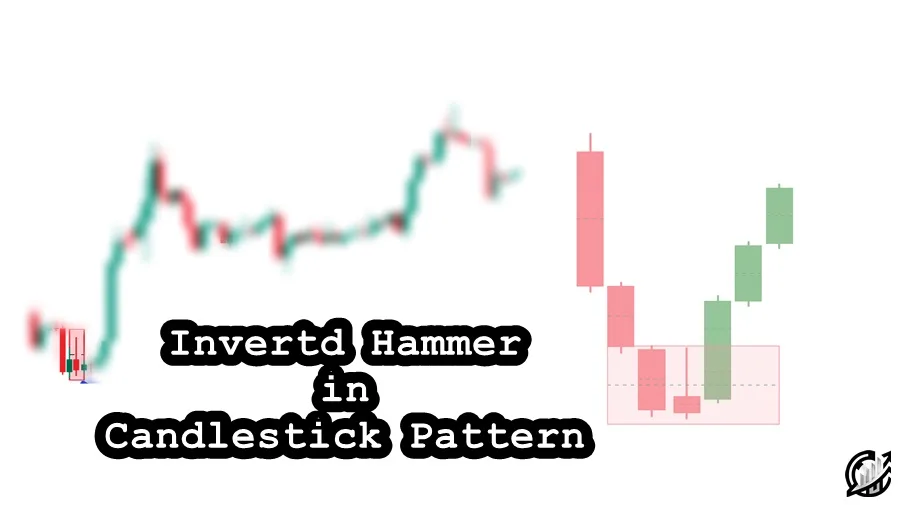
Because shooting star and inverted hammer pattern are visually identical — small body near the bottom, long upper wick, little lower wick — the only way to tell them apart is by checking the trend leading into the candle:
| Feature | Shooting Star | Inverted Hammer |
|---|---|---|
| Appears after | An uptrend | A downtrend |
| Typical bias | Bearish reversal warning | Bullish reversal (tentative) |
| Shape | Identical | Identical |
| What it suggests | Buyers rejected at highs | Buyers testing higher prices |
This is yet another example of why no single candlestick pattern can ever be judged purely by its shape — the surrounding trend does most of the interpretive work.
How Reliable Is the Shooting Star Pattern?
Reliability comes down to context and confirmation, just as it does with every reversal pattern on this list. A shooting star that forms:
- After a strong, stretched-out rally that already looks overextended
- Right at a level where price has struggled to break through before
- With clearly elevated volume compared to recent candles
…tends to be far more trustworthy than a random shooting star shape appearing without any of that supporting context. Traders who treat every shooting star as an automatic sell signal are frequently caught off guard by continued upside; traders who wait for confirmation tend to have a much better track record with this pattern.
“A shooting star without confirmation is just a scary-looking wick. Confirmation is what turns it into a real signal.”
How to Trade a Shooting Star Candlestick
- Confirm you’re in a genuine, established uptrend before treating the shape as a valid shooting star.
- Check whether the pattern is forming near a meaningful resistance level, trendline, or round number.
- Compare the candle’s volume to recent bars — elevated volume adds real weight to the signal.
- Wait for the next candle to close bearish as confirmation before considering a short entry.
- Place your stop loss just above the high of the shooting star’s wick.
- Target the next visible support level or use a fixed risk-reward ratio.
“The shooting star shows you the rejection happened. The next candle shows you whether the market agrees.”
Common Mistakes Traders Make With the Shooting Star
- Ignoring the prevailing trend, treating any similarly-shaped candle as bearish even without a genuine uptrend behind it.
- Skipping confirmation, selling immediately when the shooting star forms instead of waiting for the following candle.
- Forgetting about volume, missing the difference between a real rejection and a low-conviction wick.
- Trading shooting stars in choppy, directionless markets, where the pattern carries far less predictive value.
- Setting stops too tight, getting stopped out by normal volatility just above the shooting star’s high before the real move develops.
Can a Shooting Star Pattern Fail?
Yes — and it fails more often than beginners expect, especially in strong bull markets or during periods of high positive momentum. Price can continue climbing right through the shooting star’s high, particularly around major news catalysts or earnings surprises. This is exactly why waiting for the next candle’s confirmation, combined with a properly placed stop loss, remains essential rather than optional.
“A shooting star improves your odds of catching a reversal. It doesn’t guarantee one.”
Final Thoughts
The shooting star candlestick pattern captures one of the more dramatic moments in price action trading — a rally reaching for new highs, only to be firmly and visibly rejected within a single candle. Its value comes not from the shape in isolation, but from reading it correctly against the trend, the resistance level, and the volume surrounding it.
“Learn to spot the rejection at the top, and uptrends stop looking invincible the moment cracks begin to show.”
Start by studying historical charts for shooting star patterns forming at clear resistance levels after extended uptrends, and observe how price actually behaved in the candles that followed. That hands-on practice is what eventually turns pattern recognition into genuine trading confidence.

I’m Abdullah Shah, a content writer with three years of experience in crafting engaging and informative content. My background in market analysis complements my work, allowing me to create content that resonates with audiences. I’m also a seasoned practitioner in the forex and crypto markets, with a strong foundation and deep interest in finance. My passion for the financial world drives me to produce content that is both insightful and valuable for those interested in understanding market trends and financial strategies.