Two short names keep showing up together in trading circles right now: CRT and TBS. On their own, each one is fairly simple. Put together, they form a small but complete method for reading a chart, spotting a false move, and timing an entry around it.
This guide walks through both pieces in plain terms, shows how they fit together, and gives an honest answer to the question every new trader asks first — does it actually work?
What CRT Actually Means?
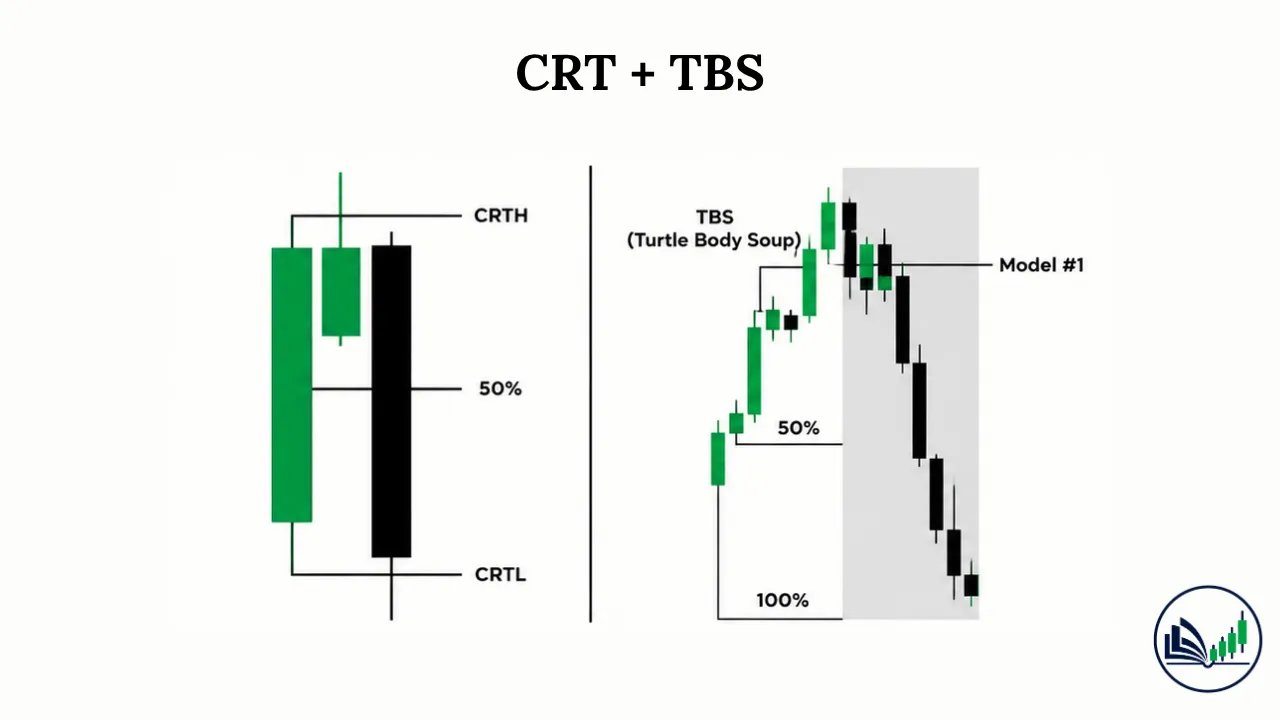
Candle Range Theory, usually shortened to CRT, starts with a simple idea: treat one candle on a higher timeframe as a small container. That single candle has a top and a bottom, and everything that happens inside those two lines counts as its “range.”
Here’s where it gets useful. Sometimes price pushes past the edge of that range — above the top or below the bottom — and then turns back inside before the candle closes. CRT reads that push-and-return as a clue. The theory says price was never really trying to escape the range; it was hunting for orders sitting just past the edge, then pulling back to head toward the opposite side instead.
Picture a four-hour candle. Its low sits at a certain price. A little later, on a smaller timeframe, price dips below that low, grabs whatever stop-losses were waiting there, then climbs back above it. CRT treats that dip as a trap, not a real breakdown, and expects the next move to aim for the high of that same four-hour candle.
Everything discussed above is not new.. Traders following Wyckoff’s work decades ago described almost the same pattern under different names — a spring below support, followed by a real rally. CRT is a newer label placed on an old, well-tested idea.
It also helps to notice why this works, at least in theory, rather than just memorizing the shape of it. Large orders don’t get filled in one click the way a small retail trade does. A big position often needs a pool of opposing orders to trade against, and those pools tend to sit just beyond an obvious high or low, in the form of stacked stop-losses.
A brief push past the edge of a CRT range can be read as exactly that kind of pool being tapped, rather than a genuine change in direction. Once that pool is used up, there’s less reason for price to keep pushing the same way, which is part of why a pullback toward the opposite side of the range often follows.
What Turtle Body Soup (TBS) Adds?
CRT tells you which direction a fake-out is likely to send price. It doesn’t tell you exactly when to click buy or sell. That’s the gap TBS, short for Turtle Body Soup, is built to fill.
TBS asks for two things, in order. First, a candle has to actually close beyond a level — not just wick past it, but close there, body and all. That matters because a wick alone can vanish in a blink, while a closed candle shows real commitment from whoever was pushing price. Second, the very next candle has to close back on the other side of that first candle, undoing the move. That second close is the confirmation. Without it, TBS treats the setup as unfinished.
There’s a related term worth knowing: Turtle Wick Soup, or TWS. It follows the same basic pattern, except the first move only pokes past the level with a wick rather than a full body close. Most traders who use this method rank TBS above TWS, since a closed candle carries more weight than a shadow that disappears within seconds.
Why does the close matter so much more than the wick? Think about what a wick actually represents — price touched a level for a moment, then pulled away before the candle finished forming. Nobody was forced to accept a trade at that extreme price for any real length of time. A closed candle is different. It means buyers or sellers were still willing to hold that price when the candle’s period ended, which suggests the move had more genuine weight behind it, even if it later gets reversed. That small distinction is the entire reason TBS exists as a separate, stricter rule instead of just merging with TWS into one looser pattern.
Putting the CRT and TBS Together
The reason CRT and TBS get paired so often comes down to timeframe. CRT works best zoomed out — reading a four-hour or daily candle to figure out where the range and the likely target sit. TBS works zoomed in, on something like a fifteen-minute or five-minute chart, where the actual closes needed for confirmation are easier to see clearly.
In practice, a trader marks the CRT range first. That gives a bias: bullish if the sweep happened below the range, bearish if it happened above. Then they drop down to a smaller chart and wait specifically for a TBS pattern to form near that swept level. The bigger picture sets the direction; the smaller picture times the click. Here is an example of CRT + TBS:
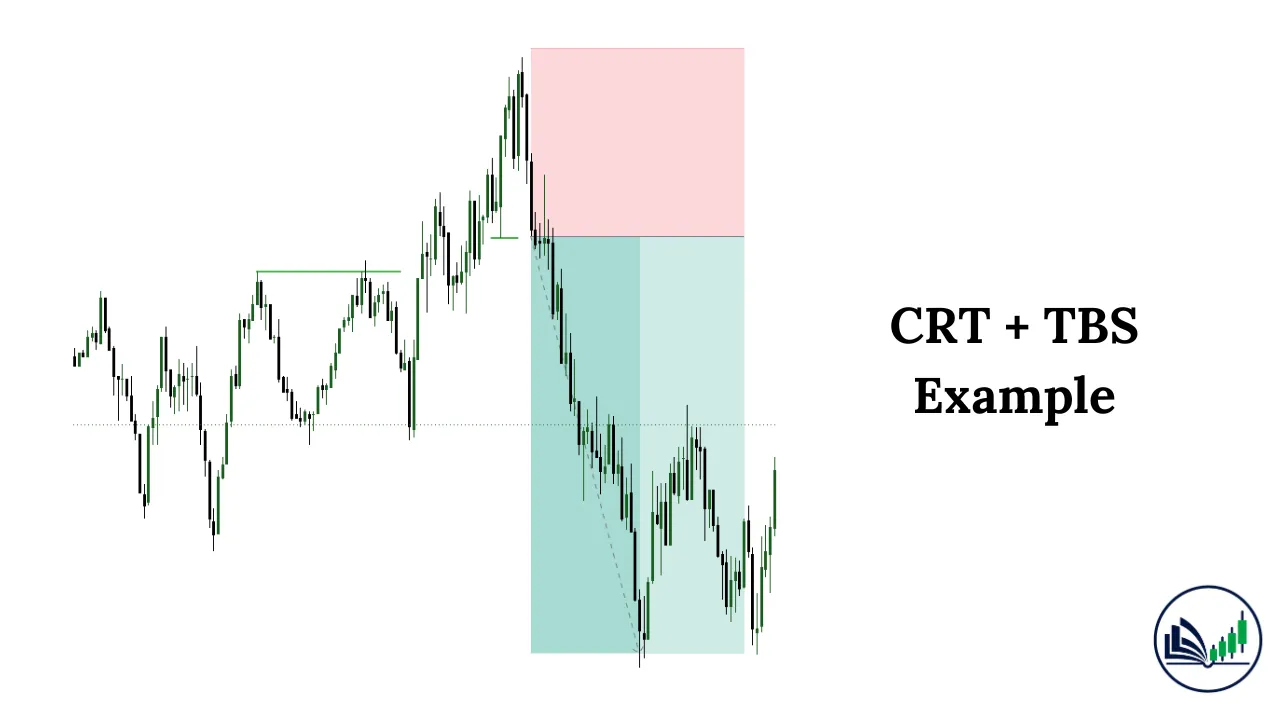
A Simple Step-by-Step Walkthrough
Here’s roughly how a trade using this method tends to unfold, broken into stages:
- Step one — pick your higher timeframe. A common pairing is a four-hour candle read from a fifteen-minute chart, though some traders scale this up or down depending on how they trade.
- Step two — mark the range. Note the high and low of the candle you’re watching. These two lines are your CRT boundaries.
- Step three — wait for the sweep. Watch for price to push beyond one edge of that range on the smaller timeframe.
- Step four — look for the TBS close. Check whether the candle making that push actually closes beyond the level, rather than just wicking through it.
- Step five — wait for the reversal candle. The next candle needs to close back on the other side, canceling out the first move. This is the trigger.
- Step six — set your stop and targets. A stop typically sits just beyond the extreme of the sweep. Many traders take a first target at the midpoint of the original range, then aim for the opposite edge of that range as a second target, often moving their stop to breakeven once the first target is hit.
- Step seven — manage the trade. From here, it’s standard risk management — protecting gains, avoiding the urge to move a stop the wrong way, and accepting that not every setup will play out.
Is CRT + TBS Actually Accurate?
This is worth answering honestly, because a lot of what circulates online about this method leans on eye-catching numbers. Some social posts throw around figures like ninety percent accuracy. Treat those claims with real skepticism. There’s no published, independently checked study behind numbers like that, and even the creators of dedicated CRT and TBS material tend to walk the claim back when pressed.
That’s actually reasonable advice, even if it’s less exciting than a big percentage. No pattern-based strategy wins every time, and any method built around reading candle closes will occasionally get faked out by a stronger, genuine breakout that simply looks similar in the moment.
How CRT + TBS Relates to ICT?
If you’ve spent any time studying ICT concepts — liquidity sweeps, market structure shifts, the broader accumulation-manipulation-distribution cycle — a lot of CRT and TBS will already sound familiar. That’s not a coincidence. Both ideas grew directly out of that same body of work, condensed into a narrower, easier-to-teach shape.
CRT is really just a liquidity sweep read on a single candle instead of a full swing structure. TBS is a stricter, more specific version of the same reversal logic ICT traders already use when a structure shift gets confirmed by a decisive close. Neither concept replaces the fuller ICT framework — they’re closer to a simplified entry point into it, useful for a trader who wants one clear rule to practice before tackling the wider methodology.
That’s worth keeping in mind if you come across content framing CRT and TBS as some kind of separate, superior discovery. The mechanics are sound and genuinely useful to learn. The framing, in most cases, is just newer branding on ideas that were already well documented.
Final Note
CRT gives you a lens for spotting when a candle’s range is likely to send price toward its opposite side. TBS sharpens that read into an actual, checkable trigger — a body close past a level, followed by a body close back the other way. Used together across two timeframes, they form a compact, teachable method that doesn’t require memorizing dozens of separate patterns.
Like anything in trading, the real value shows up over time, through repetition, not through a single flashy statistic. Mark the ranges. Wait for the full confirmation. Manage risk the same way every time. That discipline, far more than the label attached to the strategy, is what tends to decide whether a method like this actually pays off.

I’m Abdullah Shah, a content writer with three years of experience in crafting engaging and informative content. My background in market analysis complements my work, allowing me to create content that resonates with audiences. I’m also a seasoned practitioner in the forex and crypto markets, with a strong foundation and deep interest in finance. My passion for the financial world drives me to produce content that is both insightful and valuable for those interested in understanding market trends and financial strategies.