Every great bull market in history began the same way — not with a dramatic breakout or a news headline, but with a quiet, almost invisible period of institutional buying that most retail traders completely miss.
That quiet period is what Richard Wyckoff called the accumulation phase — and understanding it is one of the most powerful edges a trader can develop. When you know how to read an accumulation structure, you can identify the moment large institutions have finished buying before the big move begins, and position yourself alongside the most well-funded participants in the market.
This guide breaks down the Wyckoff accumulation pattern completely — from its first event to its final breakout — in plain, practical language.

What Is Wyckoff Accumulation?
Wyckoff accumulation in Wyckoff Theory is a sideways price range that forms at the bottom of a downtrend. It represents a period where institutional investors — the “strong hands” — are quietly absorbing shares from retail traders who are panic-selling or cutting losses.
The process transfers asset ownership from weak hands (retail, fearful, reactive traders) to strong hands (institutions, funds, smart money with long-term intent). By the time accumulation is complete, the supply of willing sellers has been exhausted, and price is ready to move sharply higher.
The challenge is that accumulation is deliberately designed to look unattractive. The news is bad. Sentiment is bearish. Price seems to be going nowhere. That’s exactly the point — the Composite Man needs retail traders to remain disinterested while he quietly builds his position.
The 5 Phases of Wyckoff Accumulation (A Through E)
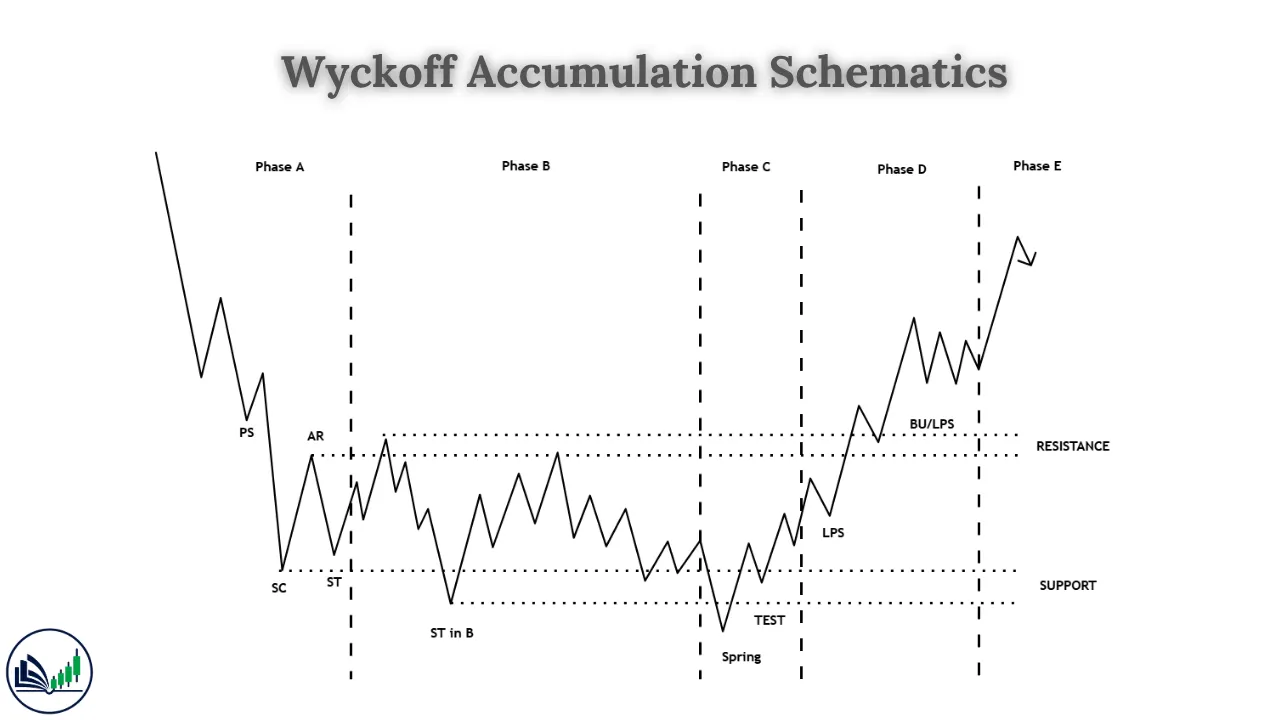
Phase A: The Downtrend Stops
Phase A marks the end of the prior downtrend and the establishment of the trading range. It contains four mandatory events:
Preliminary Support (PS): The first sign that selling pressure is being absorbed. Volume spikes 100–150% above average as institutional buyers begin stepping in. Price doesn’t reverse yet — but the rate of decline slows noticeably.
Selling Climax (SC): The most important event in Phase A. This is peak panic — a sharp, high-volume candle (or series of candles) where retail traders capitulate and dump their positions en masse. Volume often spikes 200–400% above average. The candle typically has a long lower wick, showing that aggressive buyers absorbed the panic sellers immediately.
💡 Key insight: The Selling Climax is NOT the bottom of the market — it is the bottom of the trading range. Price will revisit this area several more times before breaking out.
Automatic Rally (AR): Following the SC, buying pressure temporarily overwhelms remaining sellers, pushing price sharply higher. This rally establishes the ceiling of the accumulation range. Volume is typically 70–90% of SC volume.
Secondary Test (ST): Price returns to test the SC area — but this time with significantly lower volume (40–60% of SC volume). The reduced volume confirms that selling pressure is genuinely weakening. Price holds above or near the SC low. This test establishes the floor of the accumulation range.
Phase B: Absorption (The Foundation Is Built)
Phase B is the longest phase — often lasting 40–70% of the total accumulation structure’s duration. During this phase, institutions are systematically absorbing the remaining supply through a series of back-and-forth price movements within the established range.
What to observe in Phase B:
- Multiple tests of the support area (SC/ST level) — each with slightly lower volume
- Multiple tests of the resistance area (AR high) — each with slightly lower momentum
- Progressive contraction of volatility as supply is absorbed
- Volume gradually declining across the range
To the casual observer, Phase B looks like “nothing is happening.” That’s the point. Most retail traders lose interest and move on — right before the move begins.
Phase C: The Spring (The Trap)
Phase C contains the most critical — and most misunderstood — event in the entire accumulation structure: the Spring.
The Spring is a brief, false breakdown below the support level established in Phase A. Price penetrates the SC/ST low by 2–5%, triggering stop-losses of traders who were correctly long and inducing short sellers to enter new positions.
Then, quickly — usually within 1–3 candles — price reverses back above the support level.
Why does the Spring happen?
The Composite Man engineers this false breakdown deliberately:
- To flush out weak longs — retail traders who were patiently waiting, now stopped out
- To invite new short sellers — who will later be forced to cover (buy back), fueling the rally
- To fill remaining buy orders at the lowest possible price before markup begins
The Spring is the most powerful entry signal in Wyckoff accumulation. Volume during the Spring is typically low-to-moderate (not extreme), confirming that selling pressure is thin despite the breakdown.
Phase D: Sign of Strength (Institutions Show Their Hand)
Phase D follows the Spring and confirms that the accumulation is complete. Price makes an explosive move above the top of the range (the AR high) on significantly increased volume — typically 100–200% above average.
This move is called the Sign of Strength (SOS).
After the SOS, price often pulls back to retest the broken resistance level, which now acts as support. This pullback is called the Last Point of Support (LPS) — and it is typically the best risk-to-reward entry point in the entire structure.
| LPS Entry Characteristics | What to Look For |
|---|---|
| Volume on pullback | 40–60% below SOS volume (low, confirming weak selling) |
| Candle behavior | Quick rejection within 1–3 candles |
| Price level | Higher than the SC/ST area — shows structural strength |
| Risk-to-reward | Typically 1:5 to 1:8 from LPS to the projected target |
Phase E: The Markup (The Payoff)
Phase E is the sustained uptrend that follows successful accumulation. Supply is exhausted, the Composite Man is fully positioned, and price rises with healthy momentum — making higher highs and higher lows with increasing volume on up-moves and declining volume on pullbacks.
This is when retail traders finally “get it” and start buying — often well into the move, at prices the institutions accumulated for a fraction of the cost.
All Key Wyckoff Accumulation Events at a Glance
| Event | Symbol | Phase | What It Means |
|---|---|---|---|
| Preliminary Support | PS | A | First institutional buying; slows the decline |
| Selling Climax | SC | A | Peak panic selling; establishes range floor |
| Automatic Rally | AR | A | First bounce; establishes range ceiling |
| Secondary Test | ST | A | Low-volume retest of SC; confirms floor |
| Secondary Test in Phase B | ST-B | B | Multiple range tests; absorption continues |
| Spring | SP | C | False breakdown; the shakeout before the move |
| Test of Spring | TSP | C | Low-volume retest confirms Spring held |
| Sign of Strength | SOS | D | Breakout above range with strong volume |
| Last Point of Support | LPS | D | Optimal re-entry after SOS breakout |
| Back Up to the Edge of the Creek | BU/BUEC | D | Retest of resistance turned support |
| Markup | — | E | Sustained uptrend; accumulation complete |
How to Trade Wyckoff Accumulation: Step by Step
| Step | Action | Detail |
|---|---|---|
| Step 1 | Confirm prior downtrend | Accumulation only forms after a meaningful decline |
| Step 2 | Identify SC and AR | Mark the range floor (SC) and ceiling (AR) |
| Step 3 | Watch Phase B absorption | Look for declining volume on each range test |
| Step 4 | Wait for the Spring | Price briefly breaks below SC/ST area on low volume |
| Step 5 | Confirm the Spring holds | Wait for price to close back inside the range |
| Step 6 | Enter on LPS or Spring test | Set stop below the Spring low |
| Step 7 | Target the markup | Project move = height of the range (Point & Figure or range height method) |
Common Mistakes When Trading Wyckoff Accumulation
- Entering during Phase B — price is still ranging; the move hasn’t started yet
- Confusing a deep Phase B test for the Spring — the Spring specifically involves a false break below support, not just a touch
- Missing the LPS — many traders chase the SOS breakout; the LPS offers better entry with lower risk
- Ignoring higher timeframe context — accumulation in a downtrending market on the weekly is still a losing trade
Conclusion
The Wyckoff accumulation pattern is not a quick trade setup — it is a map of how institutional capital enters the market. Learning to read it means learning to see what retail traders can’t: the deliberate, patient work of smart money building a position before a major move.
The Selling Climax tells you where the range began. Phase B tells you the institutions are still buying. The Spring tells you they’ve finished. The Sign of Strength tells you the move has started. And the Last Point of Support gives you one final, lower-risk chance to join before the markup takes hold.
Follow the phases. Trust the volume. Trade the structure.

I’m Aatiq Shah, a dedicated forex and crypto market practitioner with three years of hands-on experience. Currently, I’m working as a Financial Manager. My journey in the world of finance has equipped me with the skills and knowledge needed to navigate the complexities of the forex and crypto markets.