Every major market top follows a pattern. While retail traders are celebrating new highs, chasing momentum, and reading bullish news, the largest institutional participants are quietly doing the opposite — they are selling.
This process of smart money exiting at the top while retail money pours in is what Richard Wyckoff called distribution. It is the mirror image of accumulation: instead of institutions absorbing supply at the bottom, they are offloading supply at the top, passing their holdings to the latecomers just before the price collapses.
Understanding Wyckoff distribution doesn’t just protect your profits — it gives you the ability to profit from the decline by identifying the top before it happens.
What Is Wyckoff Distribution?
Wyckoff distribution in Wyckoff theory is a sideways trading range that forms at the peak of an uptrend. It is the phase where institutional traders systematically exit their long positions by selling into the buying demand created by retail traders who are arriving late to the party.
Just as accumulation is invisible to most traders because sentiment is bearish, distribution is invisible because sentiment is bullish. News is positive. Everyone expects new highs. FOMO (fear of missing out) is at its peak.
That environment is precisely what the Composite Man needs — a large pool of retail buyers willing to absorb his enormous sell orders without immediately crashing the price.
The result is a sideways range at the top — one that can last weeks or months — before price finally breaks down into the markdown phase.
The 5 Phases of Wyckoff Distribution (A Through E)
Phase A: The Uptrend Ends
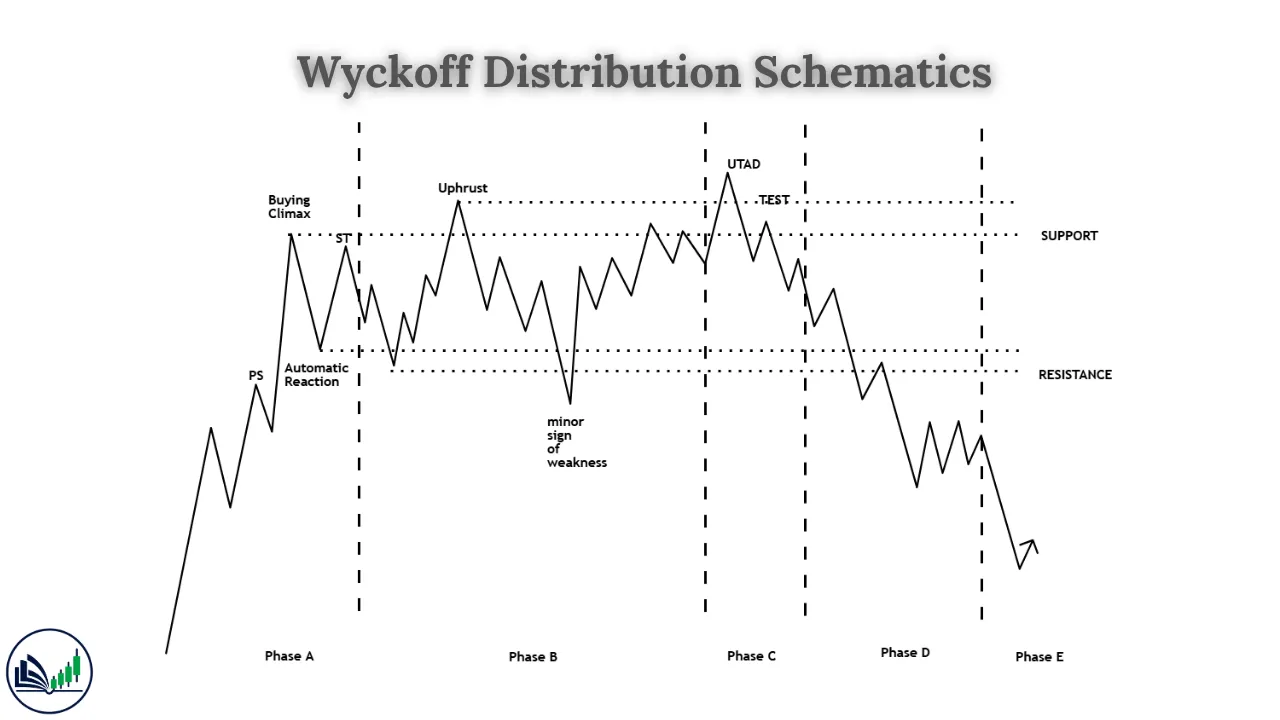
Phase A marks the stopping of the prior uptrend and the beginning of the distribution range. It contains four key events:
Preliminary Supply (PSY): The first sign that selling pressure is beginning to emerge. Large sellers start testing the market by offloading positions. Volume spikes noticeably but price continues to push higher — suggesting that demand is still absorbing the supply, though with more effort required.
Buying Climax (BC): The most dramatic event in Phase A. This is the emotional peak of the uptrend — the point where retail FOMO reaches maximum intensity. Price makes a wide, aggressive push to new highs on extreme volume as the last wave of retail buyers floods in. The Composite Man is selling into every single one of those buy orders.
💡 Key insight: The Buying Climax is not a buy signal. It is the exit signal — the moment when institutional sellers are completing their distribution into peak retail demand.
Automatic Reaction (AR): Following the BC, the supply briefly overwhelms demand and price drops sharply. This establishes the floor of the distribution range. Volume is typically elevated but lower than the BC.
Secondary Test (ST): Price rallies back toward the BC high — but with noticeably less volume and momentum. The failure to exceed the BC on the same energy is the first clear sign that demand is weakening. The ST establishes the ceiling of the distribution range.
Phase B: The Distribution Range
Phase B is where the actual distribution work occurs. Institutions systematically sell their remaining holdings across a series of rallies and pullbacks within the established range.
Key observations in Phase B:
- Multiple tests of the BC/ST area (resistance) — each rally becomes weaker
- Multiple tests of the AR area (support) — each decline shows more selling pressure
- Upthrusts (UT): Brief, false breakouts above the range ceiling that trap breakout buyers, then reverse — this is a sign that supply is heavy at the top
The longer Phase B lasts, the more distribution has occurred — and the larger the eventual markdown will be (Law of Cause and Effect).
Phase C: The UTAD (Upthrust After Distribution)
Phase C is marked by the Upthrust After Distribution (UTAD) — the distribution structure’s equivalent of the Spring in accumulation, but in reverse.
The UTAD is a final, false breakout above the range resistance, typically on high volume. It looks exactly like the start of a genuine breakout and is designed to:
- Trap late buyers who take the breakout as confirmation the rally is resuming
- Trigger stop-losses of traders who were correctly short
- Allow the Composite Man to complete his distribution by selling into the last wave of optimism
The UTAD reverses quickly and decisively, closing back inside the range or below it. This reversal — especially when confirmed by bearish volume — is one of the highest-probability short entry signals in all of technical analysis.
Phase D: Confirmation of Weakness
Phase D confirms that distribution is complete and the markdown is beginning. Two key events define this phase:
Sign of Weakness (SOW): Price breaks below the range support (AR low) with increased volume. This is the first structural confirmation that selling pressure has overcome buying demand. The move is often sustained and reaches new lows below the range.
Last Point of Supply (LPSY): After the SOW, price may attempt a weak rally back toward the broken support (now resistance). This failed rally — occurring on low volume with diminishing momentum — is called the Last Point of Supply (LPSY). It represents the last opportunity to enter short positions before the full markdown takes hold.
| Event | What It Looks Like | Trading Signal |
|---|---|---|
| SOW | Break below AR support on volume | Confirms distribution complete; enter short |
| LPSY | Weak rally to broken support level | Optimal short entry; tight stop above LPSY high |
Phase E: The Markdown
Phase E is the sustained downtrend that follows successful distribution. Price makes lower highs and lower lows with increasing selling volume. Retail traders who bought during distribution are now trapped in losing positions, adding to the selling pressure through forced liquidations and stop-losses.
This is the phase where short sellers who identified the distribution early collect their profits.
All Key Wyckoff Distribution Events at a Glance
| Event | Symbol | Phase | What It Means |
|---|---|---|---|
| Preliminary Supply | PSY | A | First institutional selling; slows the advance |
| Buying Climax | BC | A | Peak retail buying; establishes range ceiling |
| Automatic Reaction | AR | A | First sharp decline; establishes range floor |
| Secondary Test | ST | A | Weak rally to BC area; confirms ceiling |
| Upthrust | UT | B | False breakout above range; traps breakout buyers |
| Sign of Weakness | SOW | B/D | Price drops below support; confirms selling pressure |
| Upthrust After Distribution | UTAD | C | Final bull trap; last exit/short entry signal |
| Last Point of Supply | LPSY | D | Weak rally to broken support; best short entry |
| Markdown | — | E | Sustained downtrend; distribution complete |
How to Trade Wyckoff Distribution: Step by Step
| Step | Action | What to Do |
|---|---|---|
| Step 1 | Confirm prior uptrend | Distribution only forms after a significant rally |
| Step 2 | Identify BC and AR | Mark range ceiling (BC) and floor (AR) |
| Step 3 | Watch Phase B upthrusts | Multiple UT rejections at resistance confirm supply |
| Step 4 | Identify the UTAD | Watch for false breakout above range on high volume |
| Step 5 | Confirm UTAD reversal | Price closes back inside range within 1–3 candles |
| Step 6 | Enter short at UTAD or LPSY | Stop above UTAD high or LPSY high |
| Step 7 | Target the markdown | Project decline = height of the distribution range |
Wyckoff Distribution vs. Wyckoff Accumulation
| Feature | Accumulation | Distribution |
|---|---|---|
| Where It Forms | After a downtrend | After an uptrend |
| Institutional Activity | Buying (absorbing supply) | Selling (offloading positions) |
| Key Shakeout Event | Spring (false breakdown) | UTAD (false breakout) |
| Confirmation Event | Sign of Strength (SOS) | Sign of Weakness (SOW) |
| Optimal Entry | Long on LPS | Short on LPSY |
| What Follows | Markup (uptrend) | Markdown (downtrend) |
| Retail Sentiment | Bearish / fearful | Bullish / euphoric |
Conclusion
Wyckoff distribution is the market’s clearest warning signal — a structured, repeatable pattern that tells you institutional participants are leaving before the crowd even suspects a top is in place.
The Buying Climax marks the peak. The Upthrust After Distribution sets the trap. The Sign of Weakness confirms the exit. And the Last Point of Supply gives you one final, high-probability opportunity to get short before the markdown unfolds.
Most traders see the bullish news and the new highs and feel excitement. Wyckoff traders see the same chart and feel confirmation — because they know that euphoria is the Composite Man’s most powerful tool for distribution.
Study the events. Read the volume. Watch for the UTAD. And never buy a Buying Climax.

I’m Abdullah Shah, a content writer with three years of experience in crafting engaging and informative content. My background in market analysis complements my work, allowing me to create content that resonates with audiences. I’m also a seasoned practitioner in the forex and crypto markets, with a strong foundation and deep interest in finance. My passion for the financial world drives me to produce content that is both insightful and valuable for those interested in understanding market trends and financial strategies.