Table of Contents
In order to be accurate in trend analysis, it is crucial to understand and spot trends in real market. Depending on the type of trading, different timeframes are used. Traditional as well as Smart Money Concepts are used for trend and market analysis. Traditional technical analysis makes the things difficult to understand. SMC and ICT concepts helps in understanding market structure on different timeframes.
This article explores types of trends depending on market structure, challenges of diverging trends, and how to align trends of different timeframes.
Trend Analysis in Trading
First step in technical analysis is understanding different types of market trends. Normally, we have been taught that market moves in three different ways: uptrend, downtrend and sideways. It is true but this understanding is not enough to spot accurate trend. Trends are different on different timeframes.
For market structure and trend analysis, it is crucial to analyze trends on at least three different timeframes. On the basis on duration, there are three different types of trends: long-term, medium-term, and short-term. While there are no universal rules for assigning specific timeframes to these categories, traders generally define them by how they nest within one another.
Here is an important thing to understand, either we are trading intraday, short-term, or swing trading, it is crucial to be clear about long-term trend or Higher timeframe market structure. A short-term trend exists within a medium-term trend, and medium-term trend is part of a long-term trend.
It is crucial to note that these trends do not always move in the same direction. For example, a long-term bullish trend may encompass a medium-term bearish trend, which, in turn, contains short-term bullish swings. This misalignment can create challenges for traders, leading to conflicting signals and potential indecision.
Classification of Trends by Time Horizon
Apart from direction, trends are classified on the basis of time horizon.
Short-term Trends
Short-term trends last from few minutes to several days. Traders can pinpoint these trends on intraday charts. Scalpers and day traders trade these types of bullish and bearish short-term trends.
As a trader, your short-term trend analysis must respect higher timeframe directional bias: daily bias and weekly bias. It simply means that if you are trading intraday, you should be clear about intermediate-term trend. For bullish short-term trades, intermediate-term trend should be bullish and vice versa.
Intermediate-Term Trend
Intermediate-term trends last from few days to a few months. Swing traders can pinpoint these trends on higher timeframes charts like 4-hour and daily chart. Swing traders trade these types of bullish and bearish intermediate-term trends.
As a trader, your intermediate-term trend analysis must respect weekly and monthly timeframe directional bias. It simply means that if your are trading daily chart for swing trade, you should be clear about long-term trend.
Long-term Trends
Long-term trends are of primary interest to investors and portfolio managers. Their ultimate focus on capital appreciation and long-term growth. In technical analysis, mostly weekly and daily timeframe is used to observe swing highs and lows of a trend.
In traditional technical analysis, moving averages and trendlines are used to gauge the overall trend. A 200-day moving average is commonly used for long-term trend identification. When prices are above the 200-day moving average, the market is generally considered to be in a bullish long-term trend. On the other hand, straight lines connecting higher lows in an uptrend or lower highs in a downtrend provides visual representation of long-term trend direction.
In SMC and ICT, a market is considered bullish until Change of Character (CHOCH) occurs. In CHOCH, market breaks its structure to the downside. This reverses its trend until price reaches to higher timeframe PD array. Similarly, when market breaks its structure to upside, this turns bearish market to bullish market.
Importance of Trend Analysis in Trading
Technical analysis in financial markets is all about analyzing trends in different scenarios. It is fundamental for several reasons:
- Most of the time we are sure about directional bias of an asset. However, entries and exits become a difficult task. Trend analysis improves trade entries and exits. It enables us entering trades in the direction of the dominant trend. It enhances the probability of success.
- It helps us in managing risk efficiently. Identification of trend reversals helps traders minimize losses.
- Short-term traders can align with intermediate trends, while investors align with long-term trends.
Strength and Weaknesses of a Trend: Important Aspect of Trend Analysis
Trend analysis provides market insights. However, limiting trend analysis to whether market is moving up, down, or sideways limits market insights. True market insights come from analyzing the strength and weaknesses behind a trend.
Remember, there are various methods. From SMC & ICT to Wyckoff trading methods, there are strategies that we can use to gather true market insights. In this article, we pay especial attention to the price action strategies extracted from Wyckoff trading logic.
When the price is trend, traders expect momentum to be driven by the dominant side. However, markets rarely move in a straight line. In Wyckoff price action, the best way to gauge strength is comparing recent impulse price move with previous impulse price moves.
For example, in an uptrend, if each bullish push is weaker than the last (small candles, declining volume, or shallow higher highs), it suggests that buying pressure is losing momentum. Similarly, if bearish retracements become deeper, it indicates increasing seller activity.
One last point is that such weaknesses do not immediately signal a reversal. In Wyckoff trading, single reversal signal is not enough for trading. Further weaknesses confirm trend reversal.
There are several tools that can help analyze strength and weakness: Price action (size of candle, length of wicks, and speed of moves), Volume analysis, Market structure comparison.
Speed of a Trend
In market analysis, speed refers to the pace and angle at which price moves. In Wyckoff trading, it is an important element in assessing strength and weakness of a trend. An increasing speed reflects strong trend that reflect strong conviction from the dominant side.
Conversely, when the speed of a trend slows down, it signals diminishing momentum, even if the trend direction remains the same. Take the example of an uptrend, if price is creating higher highs with large bullish candle and minimal valid pullbacks, it shows strong buying pressure.
Here we can say that the steeper the angle, the stronger the trend appears. However, if the subsequent upward move becomes slower, with smaller candles and longer consolidations, this suggest that buying pressure is losing momentum. The same applies to a downtrend.
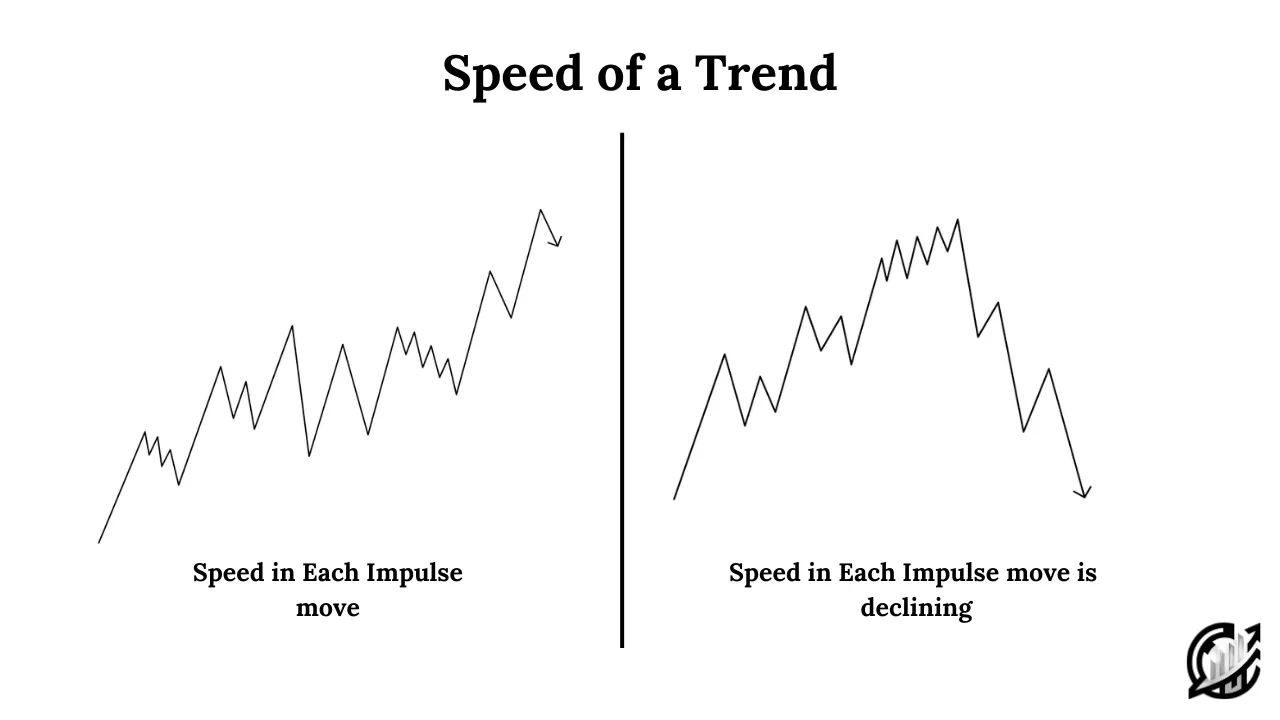
It is important to note that slower speed does not always mean reversal. It also signals a potential shift in balance. Traders must be alert. Reduced price action speed can precede consolidation, correction, or trend exhaustion. Consolidation, in this case, works as re-accumulation or redistribution. However, it depends on trend direction.
These valuable insights of market strength enable traders in making more informed decisions about entries, exits, and risk management.
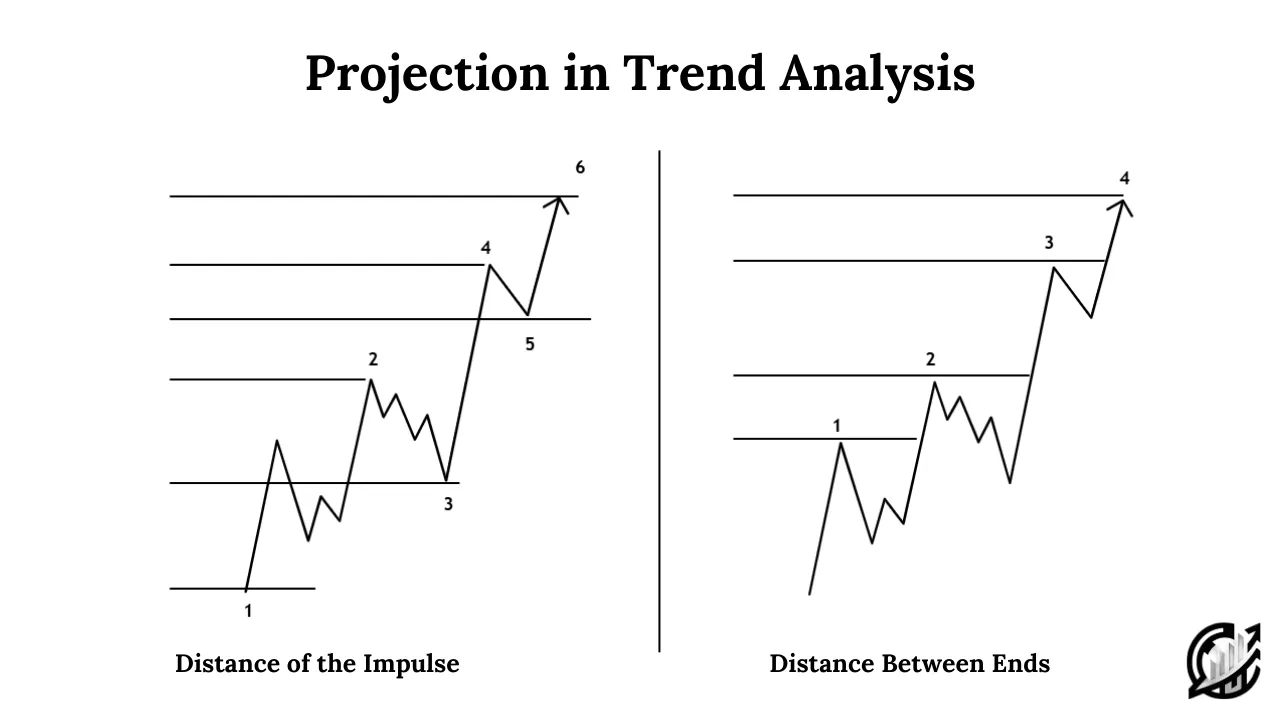
Projection in Trend Analysis
Projection in trend analysis is an essential tool that is used to compare the distance between recent price impulse and previous price impulses. As a trader, it can help you determine whether a trend is gaining strength or showing signs of weakness.
The logic in projection is simple and straight forward. In order for a trend to remain valid, ever new price impulse should be strong or even similar to the previous one. If this condition is not met, the trend could be losing momentum and nearing exhaustion.
Measuring Trend Strength with Projection
Projection analysis is based on comparison. There are no absolute values in projection analysis like ICT Fibonacci analysis. Traders look at the relative size of each impulse to understand whether buying or selling pressure is strengthening or weakening.
There are two ways of measuring trend strength with projection: Distance of the impulse, and distance between ends.
Distance of the impulse refers to how price moves in one directional push. If the distance between impulse 3 and 4 is greater than impulse between 1 and 2, it can be used as an indication of trend strength. On the other hand, if the distance between impulse 5 and 6 is smaller than between 3 and 4, it suggests that momentum is fading and the trend is weakening.
Distance between ends is the measurement of the overall progression of price between swing points. If the distance from point 2 to 3 is greater than the distance from 1 to 2, it confirms trend strength. If the distance from 3 to 4 is smaller than from 2 to 3, it reflects reduced buying and selling pressure. It is an indication of weakness.
Importance of projection
Traders refers projection as direct reflection of market psychology. In a strong uptrend, institutional buyers push price higher by breaking previous higher highs along with covering more distance with each impulse. The same applies to sellers in a downtrend.
Once impulses shorten, it shows that the dominant side is losing control and the opposite side may soon gain ground. Projection does not always mean immediate reversal. It can also lead to consolidation or correction.
Depth in Trend Analysis
In trend analysis, depth refers to the analysis of pullbacks or counter-movements within a trend. By studying the distance of these retracements, traders can assess whether the prevailing trend is still healthy or showing signs of weakness.
Measuring Depth
There are two primary ways of measuring depth of pullbacks: Pullback distance, and Distance between extremes.
In pullback distance, traders measure the length of each counter-move within the trend. If the distance between points 3 and 4 is smaller than that between 1 and 2, the pullback is weaker. It indicates trend strength. On the other hand, if the distance between 5 and 6 is larger than between 3 and 4. It indicates deep retracement and signals trend weakness.
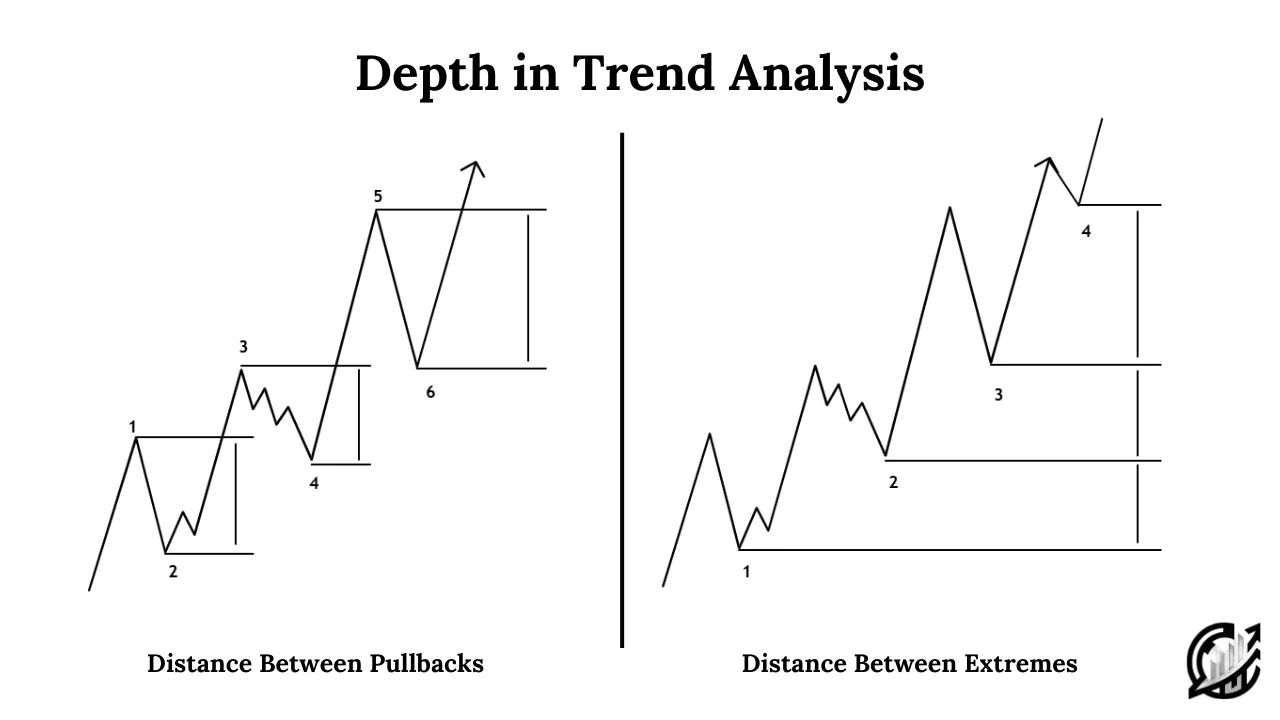
In distance between extremes, we measure the total distance from the end of one impulse to the end of the next. If the distance between 2 and 3 is smaller than between 1 and 2, it indicates trend weakness because the market is failing to advance significantly. Conversely, if the distance between impulse 3 and 4 is greater than 2 and 3, it indicates trend strength.
Final Note
Trend analysis in trading is a powerful aspect of technical analysis that traders can use to evaluate market direction and the strength or weakness behind price movement. Tools such as speed, projection, and depth provide valuable insights.
Financial markets are influenced by countless factors including economic events, liquidity shifts, and unexpected news. These factors can disrupt even the strongest trends. Traders must combine technical analysis with sound risk management. However, remember, past performance is no indicative of future results. There is always a portion of financial loss.
Frequently Asked Questions (FAQs)
What is the core purpose of analyzing trend strength and weakness in trading?
It helps traders assess whether a trend is likely to continue, slow down, or reverse. It allows for better decision-making on trade entries, exits, and risk management.
Can a weakening trend immediately reverse?
Weakness in trend often leads to consolidation or correction before reversal occurs. However, consistent weaknesses across speed, volume, projection, and depth is an early warning of a potential trend change.
How speed is used to measure trend strength?
Speed refers to the pace of price movement. Faster moves compared to previous ones suggest strong momentum, while slower moves indicate weakening pressure.

I’m Aatiq Shah, a dedicated forex and crypto market practitioner with three years of hands-on experience. Currently, I’m working as a Financial Manager. My journey in the world of finance has equipped me with the skills and knowledge needed to navigate the complexities of the forex and crypto markets.
