Most retail traders spend their time learning indicators — RSI, MACD, Bollinger Bands — and still can’t figure out why the market keeps moving against them. The truth is that these tools describe what price did after the fact. They don’t explain why price moves.
The Wyckoff Method was built to answer that question. Developed over a century ago, it remains one of the most logically sound and practically effective frameworks for understanding market behavior. And unlike most modern tools, it doesn’t just describe price — it explains the human force behind every move: the tension between supply and demand, and the strategic actions of large institutional participants.
In this guide, you’ll learn who created the Wyckoff method, what it actually teaches, how it works, and how traders still use it profitably across stocks, forex, and cryptocurrency markets today.
Who Was Richard D. Wyckoff?
Richard D. Wyckoff (1873–1934) was an American stock market investor, educator, and editor who began his Wall Street career as a teenager. By the time he was in his twenties, he had opened his own brokerage firm and was actively studying how the largest market operators of his era — figures like Jesse Livermore, J.P. Morgan, and E.H. Harriman — accumulated and distributed enormous positions without alerting the public.
Wyckoff’s key insight was this: the market doesn’t move randomly. Every significant price move has a cause behind it, and that cause is the deliberate, staged activity of large institutional participants managing enormous capital.
He spent decades codifying what he observed into a teachable methodology — a system that any trader could study and apply, regardless of whether they had access to institutional resources. He published his findings through his magazine, The Magazine of Wall Street, and later through correspondence courses that remained influential for decades after his death.
Today, the Wyckoff Method is studied by professional traders, hedge fund analysts, and retail market participants worldwide — making it one of the few early-twentieth-century trading frameworks to remain entirely relevant in the modern era.
What Is the Wyckoff Method?
The Wyckoff Method is a technical analysis framework that uses price action and trading volume to identify the current phase of the market cycle and predict where price is likely to move next.
It rests on three foundational ideas:
- Markets move in predictable cycles — not random, but driven by recurring patterns of accumulation, markup, distribution, and markdown
- Volume is the footprint of institutional activity — big players leave traces in volume data that reveal when they are buying and when they are selling
- The Composite Man concept — all institutional activity can be thought of as a single, highly intelligent operator whose goal is to buy low and sell high using other traders’ predictable behavior against them
Unlike technical indicators that react to price after it moves, Wyckoff analysis attempts to anticipate price before it moves — by identifying which phase of the cycle the market is currently in.
The Three Laws of the Wyckoff Method
Everything in Wyckoff analysis flows from three foundational laws:
Law 1: Supply and Demand
Price rises when demand (buying) exceeds supply (selling). Price falls when supply exceeds demand. When supply and demand are balanced, price moves sideways. This isn’t a new concept — but Wyckoff elevated it by teaching traders to read supply and demand through the combined lens of price and volume, rather than relying on intuition.
Law 2: Cause and Effect
Every significant price move is the effect of a prior cause. Accumulation (buying in a range) is the cause; the resulting uptrend is the effect. Distribution (selling in a range) is the cause; the downtrend that follows is the effect. The size of the cause determines the magnitude of the effect — a longer, more developed accumulation produces a bigger markup move.
Law 3: Effort vs. Result
The volume of trading activity (effort) should correspond to the resulting price movement (result). When high volume produces large price movement, the trend is healthy. When high volume produces small price movement — or the opposite direction — there is a divergence. Divergences between effort and result signal upcoming reversals or weakness in the current trend.
The Wyckoff Market Cycle: 4 Phases
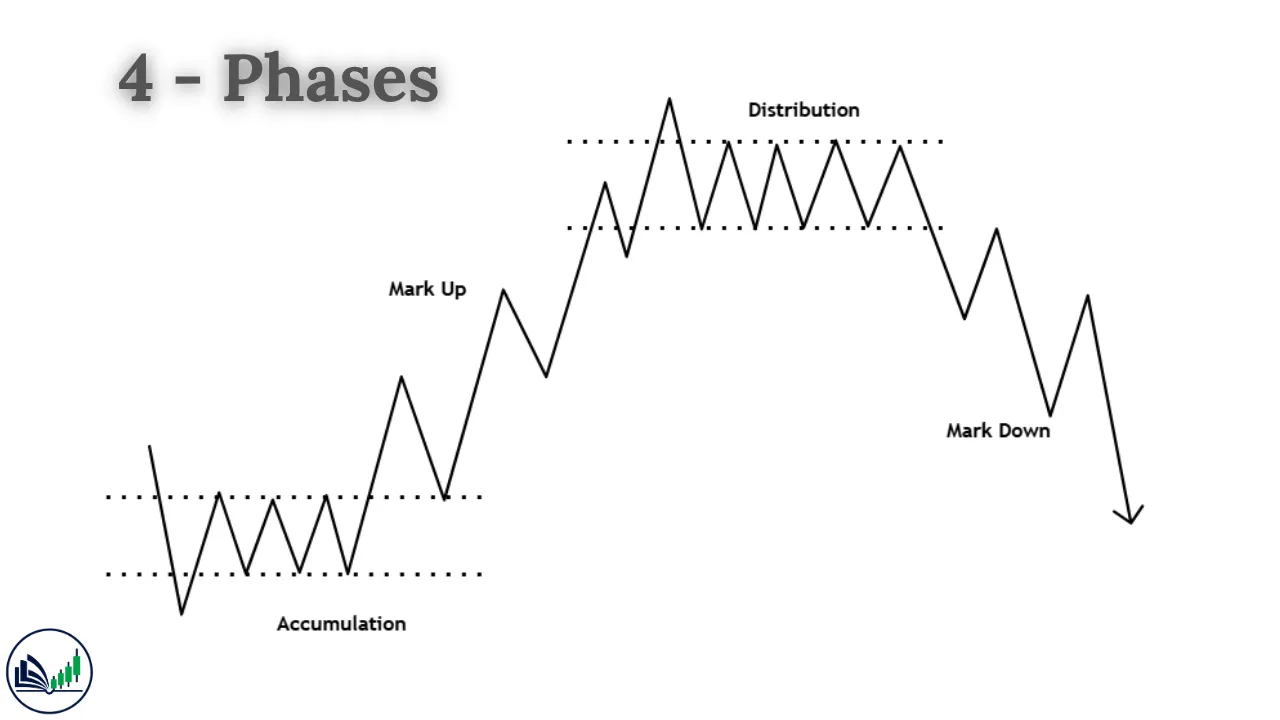
Wyckoff identified four recurring phases that every market moves through, in a continuous, repeating cycle:
| Phase | Description | What Smart Money Is Doing |
|---|---|---|
| Accumulation | Price ranges sideways after a decline | Buying quietly at low prices |
| Markup | Price trends strongly upward | Holding and letting retail traders pile in |
| Distribution | Price ranges sideways at highs | Selling quietly at elevated prices |
| Markdown | Price trends strongly downward | Holding short positions as price falls |
Understanding which phase the market is in tells you what to do: buy during accumulation, hold during markup, exit during distribution, and short during markdown.
The Composite Man: Smart Money Personified
One of Wyckoff’s most enduring concepts is the Composite Man — a fictional, all-knowing institutional participant who represents the aggregate behavior of all large market players.
Wyckoff didn’t invent this to suggest market conspiracy. He created it as a mental model — a way to ask: “If one very large, very smart operator were accumulating a position, what would the price chart look like?”
The Composite Man follows a predictable campaign:
- Accumulate large positions at low prices, keeping his buying invisible through gradual absorption
- Mark up prices once enough supply has been absorbed, creating FOMO among retail traders
- Distribute his holdings at high prices to late retail buyers
- Mark down prices once distribution is complete, triggering panic selling
Retail traders who don’t understand this framework are consistently on the wrong side. They buy into markup phases when price is already high. They hold through distribution and lose profits. They panic-sell into markdown — selling to the Composite Man who is quietly accumulating again.
How to Apply the Wyckoff Method: 5 Steps
| Step | Action | What to Look For |
|---|---|---|
| Step 1 | Define the trend | Is price in markup, markdown, or a range? |
| Step 2 | Identify the phase | Accumulation or distribution range? |
| Step 3 | Read volume | Does volume confirm or contradict the price move? |
| Step 4 | Find the spring or upthrust | The shakeout event that signals the range is ending |
| Step 5 | Enter with the trend | Long after spring in accumulation; short after upthrust in distribution |
Wyckoff vs. Modern Trading Approaches
| Feature | Traditional TA | ICT/SMC | Wyckoff Method |
|---|---|---|---|
| Primary Tool | Indicators | Order Blocks, FVGs | Price + Volume |
| Core Focus | Signal generation | Institutional entry zones | Market cycle phase identification |
| Time Horizon | Any | Intraday to swing | Swing to position |
| Volume Required | No | No | Yes (essential) |
| Best Markets | Any | Forex, indices | Stocks, crypto, indices |
| Learning Curve | Low | High | Medium–High |
| Origin | 1970s–modern | 2000s–present | 1900s (timeless) |
Does the Wyckoff Method Still Work?
The honest answer is: yes, with important context.
Wyckoff’s principles are grounded in human psychology and institutional market mechanics — neither of which has fundamentally changed. As long as large participants need to accumulate and distribute enormous positions without destroying their own price, the patterns Wyckoff described will continue to appear.
Where it works best:
- Stocks — especially mid and large caps with reliable volume data
- Cryptocurrency — Bitcoin and major altcoins regularly display textbook Wyckoff schematics
- Futures and indices — where volume data is transparent and institutional
Where it is harder to apply:
- Spot Forex — decentralized market with no true central volume data, making effort vs. result analysis unreliable
- Day trading — Wyckoff works better on higher timeframes (daily, weekly) than on 1-minute or 5-minute charts
Conclusion
The Wyckoff Method is not a collection of patterns to memorize. It is a framework for understanding why markets move — one that has remained accurate and applicable for over a century because it is built on principles that don’t change: human psychology, institutional self-interest, and the fundamental tension between supply and demand.
Whether you trade stocks, crypto, or indices, learning the Wyckoff method will fundamentally change how you read a chart. You’ll stop seeing random candles and start seeing campaigns — the deliberate accumulation, markup, distribution, and markdown of institutional operators moving through a predictable cycle.
Master the three laws. Understand the Composite Man. Recognize the four phases. And you’ll never look at a chart the same way again.

I’m Abdullah Shah, a content writer with three years of experience in crafting engaging and informative content. My background in market analysis complements my work, allowing me to create content that resonates with audiences. I’m also a seasoned practitioner in the forex and crypto markets, with a strong foundation and deep interest in finance. My passion for the financial world drives me to produce content that is both insightful and valuable for those interested in understanding market trends and financial strategies.