Every price move on a chart has a context behind it. Somebody wanted to buy, somebody wanted to sell, and one side pushed harder than the other. Most traders only see the result of that fight: a green or red candle. Order flow trading tries to watch the fight itself.
If you have ever wondered why price suddenly jumps or stalls at a certain level, this guide will help. We will explain order flow in plain language, show you the main tools, and share practical tips you can use from day one.
What Is Order Flow?
Order flow is the stream of buy and sell orders entering the market at any moment. Think of it as the market’s live heartbeat.
Imagine a busy vegetable market. If a crowd of shoppers suddenly rushes to one stall wanting tomatoes, and the seller has only a few crates left, the price of tomatoes goes up. If the seller has a mountain of tomatoes and few shoppers, the price falls. Financial markets work the same way. Order flow simply lets you see the shoppers and the crates.
So, order flow trading is a method where traders study these real orders, not just past price patterns, to judge where price is likely to go next.
Quote: “Price is what you see. Order flow is why you see it.” — A common saying among futures traders
How Does Order Flow Trading Work?
To understand order flow, you only need to know a few basic ideas.
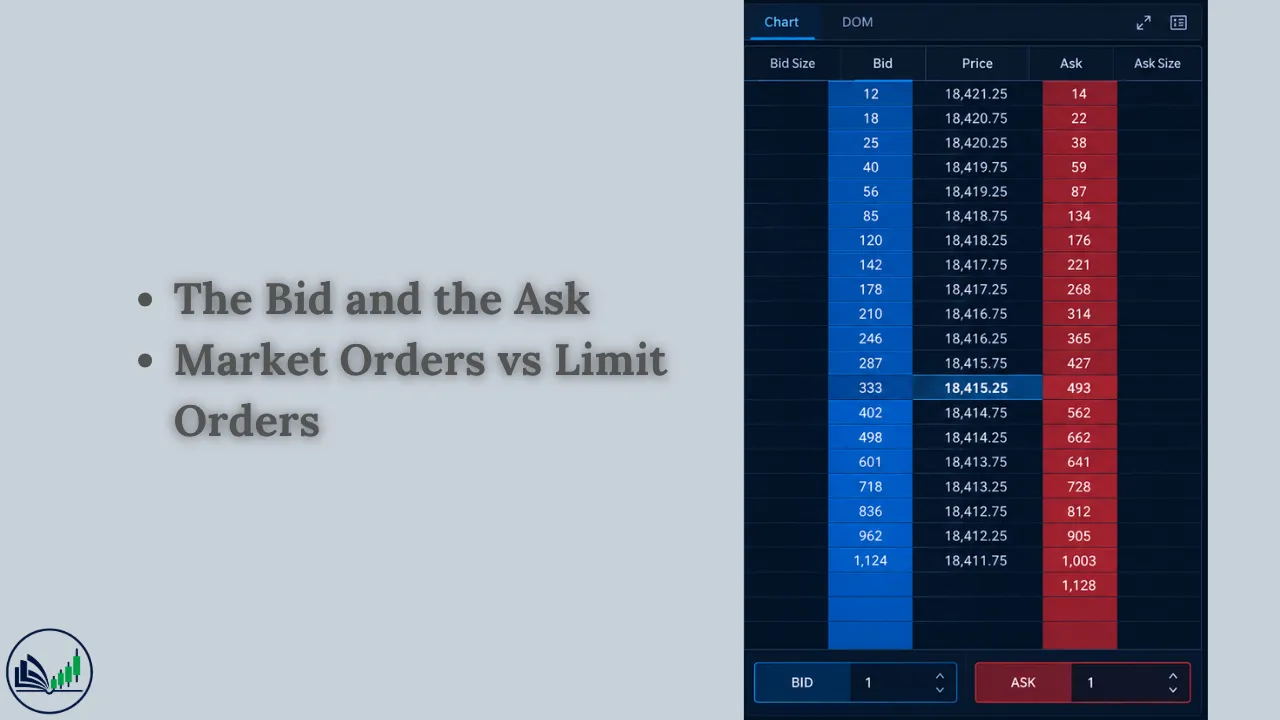
1. The Bid and the Ask
- The bid is the highest price a buyer is willing to pay right now.
- The ask (or offer) is the lowest price a seller will accept right now.
The small gap between them is called the spread.
2. Market Orders vs Limit Orders
This is the most important concept in order flow analysis.
- Limit orders wait patiently at a chosen price. They sit in the order book and provide liquidity. Traders call them passive orders.
- Market orders want to trade immediately at the best available price. They “hit” the bid or “lift” the ask. Traders call them aggressive orders.
Price moves when aggressive orders eat through all the passive orders at one level. If buyers keep lifting the ask until no sellers remain at that price, the price ticks up.
3. Supply, Demand, and Imbalance
When aggressive buyers clearly outnumber sellers, we call it an order imbalance. Imbalances often push price in their direction. Order flow traders hunt for these moments because they show who is truly in control.
💡 Tip: Don’t think of the market as “going up” or “going down.” Think of it as “buyers are winning” or “sellers are winning.” This simple shift makes order flow much easier to read.
The Main Order Flow Tools
You don’t need all of these at once. But knowing what each tool does will help you pick the right one.
Depth of Market (DOM)
The Depth of Market, also called the price ladder or Level 2, shows the limit orders waiting above and below the current price. It tells you how much market depth exists at each level.
For example, if you see a very large group of sell orders sitting at one price, that level may act as resistance, at least until buyers chew through it.
Watch out: Orders on the DOM can be cancelled in a split second. Some big players place fake orders to trick others, a banned practice called spoofing. So treat the DOM as a clue, not a promise.
Time and Sales (The Tape)
Time and sales is a running list of every completed trade: the time, price, and size. Old-school traders called this tape reading. A sudden burst of large trades at the ask, for instance, suggests serious buying pressure.
Footprint Charts
A footprint chart is like a regular candlestick opened up from the inside. Inside each candle, you see how many contracts traded at the bid and how many at the ask, at every price.
This is one of the most popular tools for an order flow trading strategy, because it shows exactly where buyers and sellers fought hardest within each bar.
Volume Delta and Cumulative Delta
Delta is a simple calculation:
Delta = Aggressive buy volume − Aggressive sell volume
- Positive delta means buyers were more aggressive.
- Negative delta means sellers were more aggressive.
Cumulative delta adds up delta over time, giving you a running score of the buyer-vs-seller battle throughout the session.
Volume Profile
Volume profile shows how much trading took place at each price level over a period. The busiest price is called the point of control. These high-volume zones often act as strong support and resistance because many traders have positions there.
Quote: “There is nothing new in Wall Street… whatever happens in the stock market today has happened before and will happen again.” — Jesse Livermore, as told in Reminiscences of a Stock Operator (1923)
Key Order Flow Signals Beginners Should Know
Absorption
Absorption happens when lots of aggressive orders hit one price, yet price refuses to move. Imagine buyers hammering the ask again and again, but price stays stuck. That means a large passive seller is quietly soaking up all the buying. Often, once buyers run out of energy, price reverses down.
Exhaustion
Exhaustion is the opposite feeling. Price pushes higher, but each push comes with smaller and smaller buying volume. The buyers are getting tired. A reversal may be close.
Iceberg Orders
An iceberg order is a big order split into small visible pieces so others can’t see its full size. On the tape, you may notice the same small order refilling at one price over and over. That is often a sign of an institutional trader, or “smart money,” hiding a large position.
Delta Divergence
If price makes a new high but cumulative delta does not, buyers are not truly supporting the move. This divergence can warn you that the rally is weak.
💡 Tip: Never trade a single signal on its own. Absorption at a key support level, plus a shift in delta, is far stronger than absorption in the middle of nowhere.
Order Flow vs Price Action: What’s the Difference?
| Feature | Price Action | Order Flow |
|---|---|---|
| What it studies | Candles, patterns, trends | Real buy and sell orders |
| Timing | Shows what already happened | Shows what is happening now |
| Tools | Basic charts | DOM, footprint, tape, delta |
| Best for | Swing and position trading | Scalping and day trading |
| Learning curve | Moderate | Steeper |
The two methods are not enemies. Many traders use price action to find key levels, then use order flow to time the exact entry at those levels.
Which Markets Work Best for Order Flow?
Order flow works best where you can see centralized volume data.
- Futures markets (such as index, gold, and crude oil futures) are ideal, because all trades pass through one exchange and the data is reliable.
- Stocks also work well, especially high-volume shares.
- Crypto offers order book data on major exchanges, though quality varies between platforms.
- Forex is tricky. The spot forex market is decentralized, so no single source shows all trades. Order flow in forex usually relies on a broker’s own data or on currency futures as a proxy.
💡 Tip: If you trade forex and want true order flow, try watching the matching currency futures contract. Its volume data is far more complete than most forex broker feeds.
Pros and Cons of Order Flow Trading
Advantages
- See real intent: You watch actual orders, not just lagging indicators.
- Precise entries: You can enter close to key levels with tighter stops.
- Spot traps early: Absorption and exhaustion can reveal fake breakouts.
- Understand the “why”: You learn how the market truly moves.
Disadvantages
- Information overload: Fast markets can feel like a waterfall of numbers.
- Costs: Good data feeds and footprint software often need a subscription.
- Steep learning curve: Reading the tape takes weeks or months of screen time.
- Manipulation: Spoofing and hidden orders can mislead you.
- Not a crystal ball: Order flow improves your odds; it never guarantees results.
How to Start Order Flow Trading: A Beginner’s Roadmap
- Learn the basics first. Make sure you fully understand bid, ask, market orders, and limit orders.
- Pick one market. A liquid futures contract is a great starting point. Don’t jump between ten markets.
- Choose one tool. Start with a footprint chart or the DOM. Master it before adding more.
- Mark key levels. Use volume profile or simple support and resistance to know where to watch.
- Watch, don’t trade. Spend a few weeks observing how orders behave at your levels.
- Paper trade. Practice on a demo or simulator account until your results are consistent.
- Keep a journal. Screenshot every setup and write what you saw in the order flow.
- Go live small. When you are ready, start with the smallest position size possible.
💡 Tip: Replay mode is your best friend. Many platforms let you replay past trading days at slow speed, so you can study order flow without the pressure of a live market.
Risk Management Still Comes First
Order flow can make you feel like you have “x-ray vision” into the market. That feeling is dangerous. Even the clearest absorption signal can fail when a big news release hits.
Follow these simple rules:
- Risk only a small, fixed percentage of your account on each trade (many traders use 1% or less).
- Always use a stop-loss, placed beyond the level where your idea is proven wrong.
- Avoid trading in the first minutes after major economic news, when order books thin out and slippage jumps.
- Stop trading for the day after a set number of losses.
Quote: “Plan the trade, and trade the plan.” — Popular trading proverb
Final Thoughts
Order flow trading is about looking under the hood of the market. Instead of guessing from candle shapes alone, you watch real buyers and sellers compete, and you learn to spot who is winning.
It isn’t magic, and it takes patience to learn. But once you understand concepts like the bid and ask, delta, absorption, and imbalance, charts stop looking like random noise. They start telling a story.
Start small, focus on one market, protect your capital, and let screen time do its work. The market speaks through its orders. With practice, you’ll learn to listen.

I’m Abdullah Shah, a content writer with three years of experience in crafting engaging and informative content. My background in market analysis complements my work, allowing me to create content that resonates with audiences. I’m also a seasoned practitioner in the forex and crypto markets, with a strong foundation and deep interest in finance. My passion for the financial world drives me to produce content that is both insightful and valuable for those interested in understanding market trends and financial strategies.