When Richard Wyckoff’s students asked him how to apply his method to real charts, he didn’t hand them a list of rules. He drew them a schematic — a visual blueprint of what institutional accumulation and distribution look like when they’re working perfectly.
That blueprint became what we now call the Wyckoff Schematic: a standardized map of market structure phases, price events, and volume signatures that tells traders exactly where a market is in its cycle and what to expect next.
Two primary schematics exist for accumulation and two for distribution, giving traders a total of four structural templates. Understanding each schematic — and knowing which one is playing out — is the culmination of everything Wyckoff taught.
This guide breaks down every schematic, every phase, and every event so clearly that you’ll be able to recognize them in live charts from your first session.

What Is a Wyckoff Schematic?
A Wyckoff Schematic is a graphical representation of the typical price and volume behavior that occurs during a Wyckoff accumulation or Wyckoff distribution trading range.
Think of it as a reference template. When you look at a chart and suspect you’re looking at an accumulation structure, you hold that chart against the schematic and ask: “Does this match? Which events have appeared? Which are still pending? Am I in Phase B or Phase C?”
The schematics serve three critical functions:
- Location — tell you where price is within the institutional campaign
- Anticipation — tell you what event should come next
- Confirmation — tell you when a phase is definitively complete
There are two accumulation schematics and two distribution schematics — four templates in total.
Accumulation Schematic #1: The Classic Structure
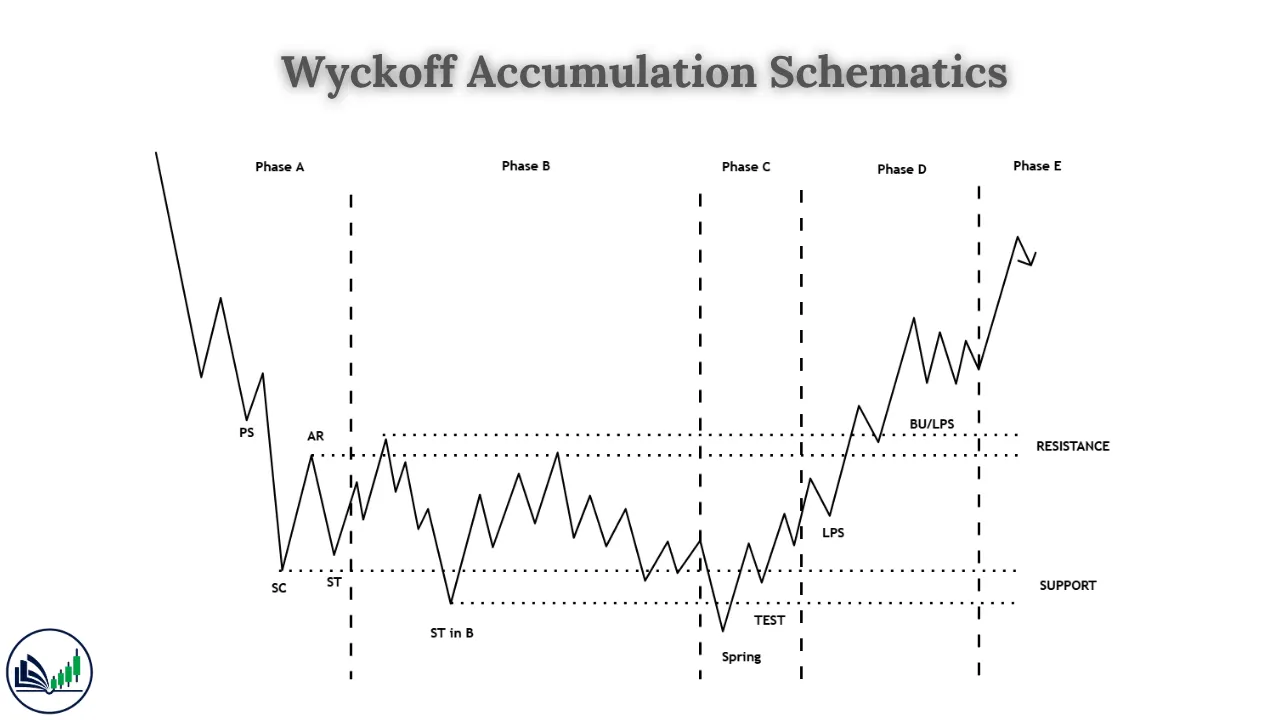
Accumulation Schematic #1 is the foundational template. It includes all five phases (A through E) with all key events present, including the most important: the Spring in Phase C.
Phase A — The Downtrend Stops
| Event | Abbreviation | What Happens |
|---|---|---|
| Preliminary Support | PS | First institutional buying; decline slows |
| Selling Climax | SC | Maximum panic selling; establishes range floor |
| Automatic Rally | AR | Sharp bounce; establishes range ceiling |
| Secondary Test | ST | Low-volume retest of SC; confirms floor holds |
Phase A defines the trading range’s boundaries: SC area = floor, AR high = ceiling.
Phase B — Absorption (The Foundation)
Phase B is the longest phase. Institutions systematically absorb remaining supply through repetitive range-bound trading. Each test of the SC area occurs with progressively lower volume — confirming that sellers are exhausting. Each rally toward the AR area shows slightly less momentum — confirming supply is being absorbed.
Duration: Typically 40–70% of the total accumulation structure.
Phase C — The Spring (The Trap)
| Event | What Happens |
|---|---|
| Spring | False breakdown below SC/ST area on low-to-moderate volume; reverses within 1–3 candles |
| Test of the Spring (TSP) | Low-volume retest confirms the Spring level holds |
The Spring is the defining event of Schematic #1. It is engineered by the Composite Man to:
- Flush weak long positions
- Attract new short sellers
- Fill the final buy orders at the lowest possible price
Volume signature of the Spring: Crucially, the Spring itself does NOT occur on extreme volume. High-volume downside on a supposed Spring suggests genuine breakdown, not a shakeout.
Phase D — Sign of Strength
| Event | What Happens |
|---|---|
| Sign of Strength (SOS) | Strong rally above AR ceiling on significantly elevated volume |
| Last Point of Support (LPS) | Low-volume pullback to former resistance; optimal entry |
| Back Up to Creek (BUEC) | Final retest of the breakout level |
The SOS is the structural confirmation that accumulation is complete. The LPS is the best risk-to-reward entry in the entire schematic.
Phase E — The Markup
Price leaves the range and begins a sustained uptrend. Higher highs and higher lows. Volume expands on rallies and contracts on pullbacks. The accumulation is complete.
Accumulation Schematic #2: The No-Spring Variant
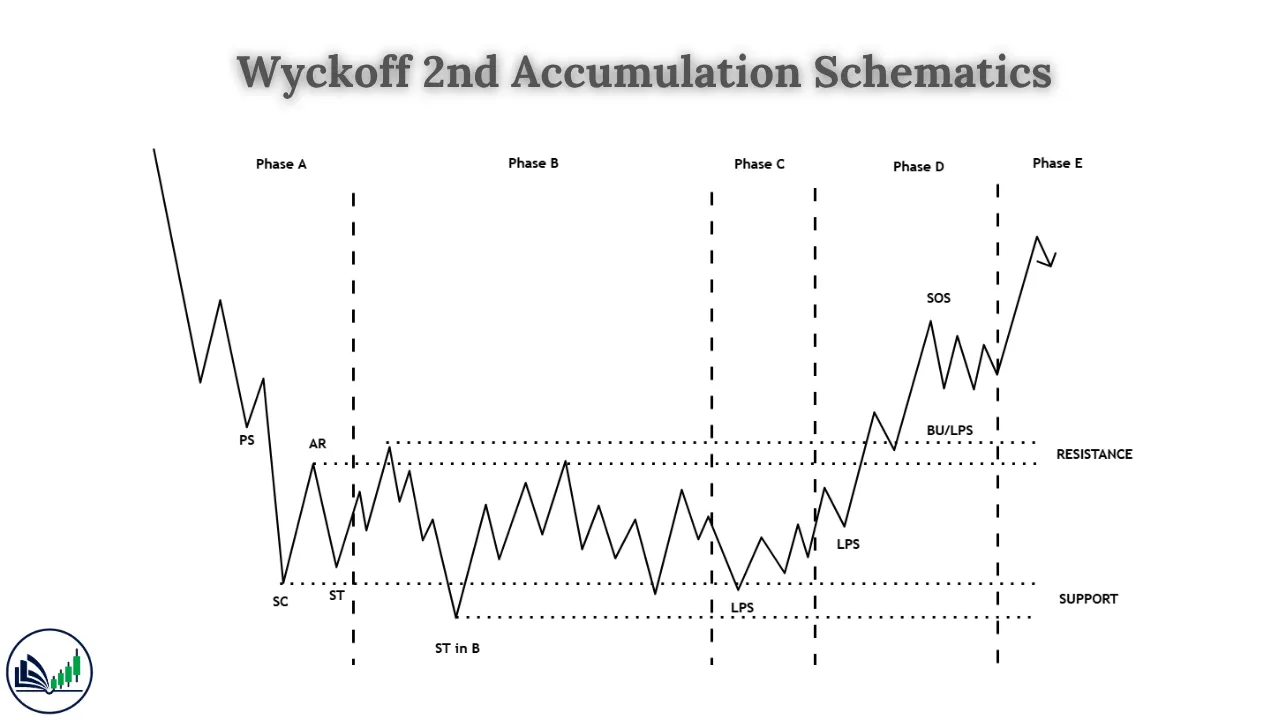
Accumulation Schematic #2 is a variant in which Phase C does not produce a Spring. Instead, price completes absorption within the range without making a false breakdown below support.
How Schematic #2 Differs from Schematic #1
| Feature | Schematic #1 | Schematic #2 |
|---|---|---|
| Phase C event | Spring (false breakdown below range) | No Spring — price tests within the range |
| Trap direction | Below the range floor | None (or very minor false test) |
| Phase B length | Moderate | Often longer — more absorption needed |
| Entry signal | Spring + LPS | LPS directly after SOS (no Spring precedes it) |
| Frequency | More common | Less common; occurs in stronger demand conditions |
| Difficulty | Easier to identify (dramatic Spring event) | Harder — requires careful volume analysis |
In Schematic #2, the Composite Man doesn’t need to engineer a Spring because enough supply was absorbed during Phase B without one. The SOS breakout still occurs, and the LPS entry still presents itself — but without the preceding Spring as a pre-signal.
Why Schematic #2 Matters
Many traders wait for a Spring and miss entries in Schematic #2 markets. When a range has spent an unusually long time in Phase B with progressively declining volume and the SC area has been tested multiple times without being broken, a Schematic #2 may be forming. In this case, the first SOS is the primary signal.
Distribution Schematic #1: The Classic Top
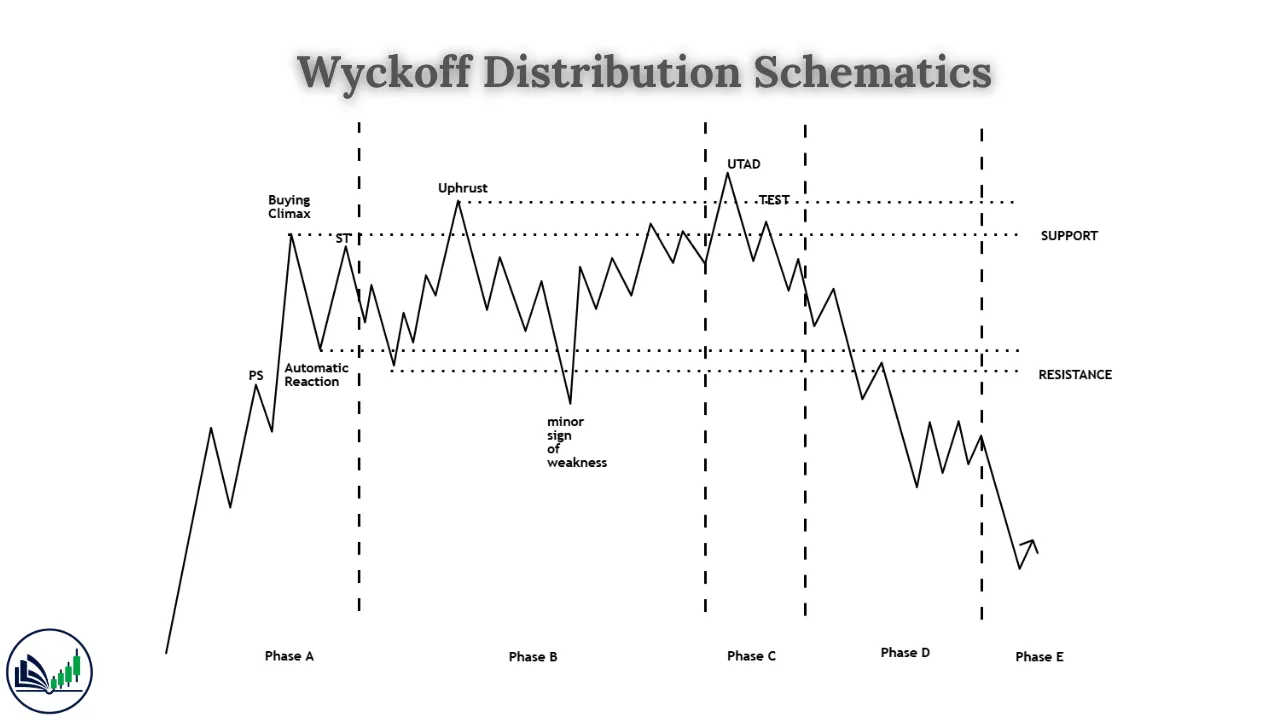
Distribution schematics are the mirror image of accumulation schematics. What the Spring is to accumulation, the UTAD (Upthrust After Distribution) is to distribution.
Phase A — The Uptrend Ends
| Event | Abbreviation | What Happens |
|---|---|---|
| Preliminary Supply | PSY | First institutional selling; advance slows |
| Buying Climax | BC | Maximum retail euphoria; establishes range ceiling |
| Automatic Reaction | AR | Sharp decline; establishes range floor |
| Secondary Test | ST | Weak rally to BC area; confirms ceiling holds |
Phase A defines the distribution range: BC area = ceiling, AR low = floor.
Phase B — Supply Building
Institutions systematically exit their positions into each rally within the range. Each push toward the BC area occurs with declining volume — demand is weakening. Each pullback toward the AR area shows increasing volume — supply is growing.
Upthrusts (UT) may occur within Phase B: brief, failed breakouts above the range ceiling that trap breakout buyers.
Phase C — The UTAD
| Event | What Happens |
|---|---|
| Upthrust After Distribution (UTAD) | False breakout above BC ceiling on high volume; reverses within 1–3 candles |
The UTAD is the distribution equivalent of the Spring — a trap in the opposite direction. It creates final retail buying demand for the Composite Man to distribute into.
UTAD volume signature: Unlike the Spring (which occurs on low-to-moderate volume), the UTAD often occurs on high volume — matching the energy of the BC, creating a convincing illusion of a genuine breakout.
Phase D — Sign of Weakness
| Event | What Happens |
|---|---|
| Sign of Weakness (SOW) | Strong decline below AR floor on elevated volume |
| Last Point of Supply (LPSY) | Weak rally to broken floor (now resistance); optimal short entry |
Phase E — The Markdown
Price leaves the distribution range in a sustained downtrend. Distribution is complete.
Distribution Schematic #2: The No-UTAD Variant
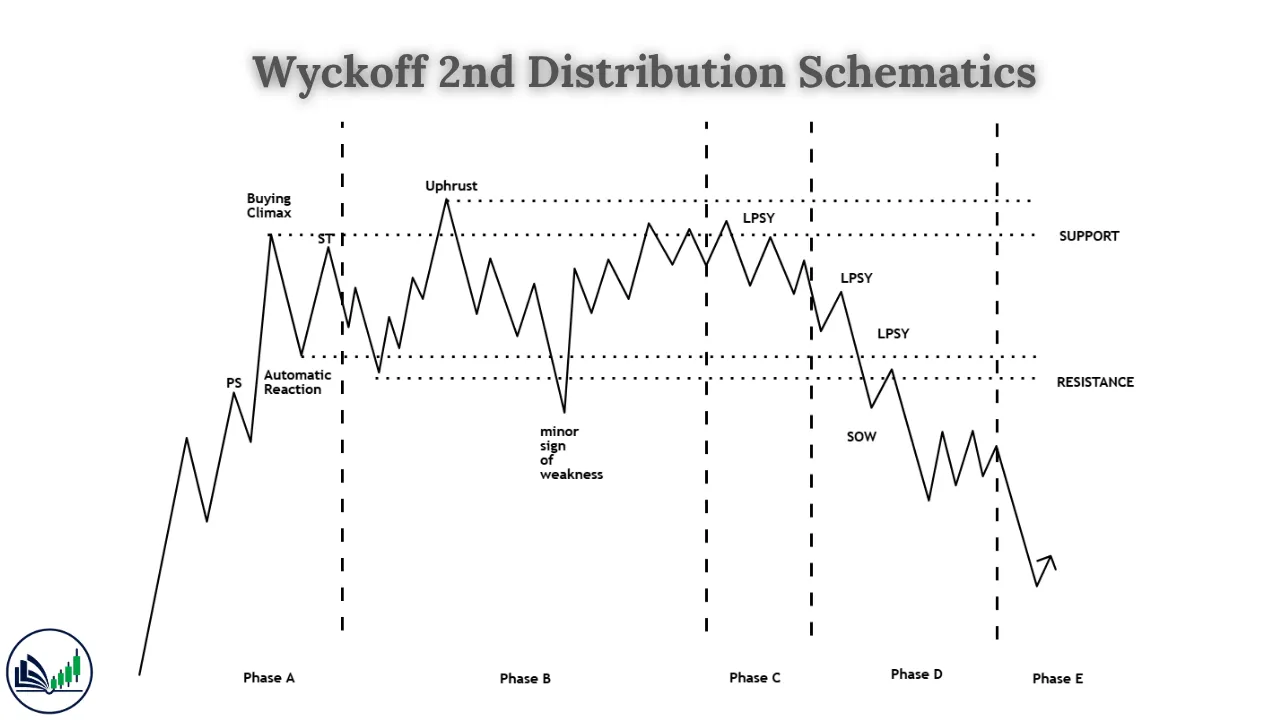
Distribution Schematic #2 is the variant in which Phase C does not produce a UTAD. Distribution completes through Phase B absorption without a false breakout above resistance.
| Feature | Schematic #1 | Schematic #2 |
|---|---|---|
| Phase C event | UTAD (false breakout above ceiling) | No UTAD — tests remain within range |
| Trap direction | Above the range ceiling | None |
| Entry signal | Short at UTAD reversal or LPSY | SOW + LPSY directly (no UTAD) |
| Frequency | More common | Less common |
| Risk of confusion | High (UTAD looks like genuine breakout) | Lower — range trading is more obvious |
Accumulation vs. Distribution: The Mirror Image
The two accumulation and two distribution schematics are precise structural mirrors of each other:
| Accumulation Element | ↔ | Distribution Equivalent |
|---|---|---|
| Selling Climax (SC) | ↔ | Buying Climax (BC) |
| Automatic Rally (AR) | ↔ | Automatic Reaction (AR) |
| Spring (false low) | ↔ | UTAD (false high) |
| Sign of Strength (SOS) | ↔ | Sign of Weakness (SOW) |
| Last Point of Support (LPS) | ↔ | Last Point of Supply (LPSY) |
| Markup phase | ↔ | Markdown phase |
This mirror-image structure means that once you can read an accumulation schematic, you can read a distribution schematic — just flip the direction of every event.
How to Identify Which Schematic You’re Looking At?
Use these four diagnostic criteria:
| Criterion | Accumulation | Distribution |
|---|---|---|
| Prior trend | Preceded by a downtrend | Preceded by an uptrend |
| Retail sentiment | Bearish / fearful | Bullish / euphoric |
| Volume on declines | Declining within range | Increasing within range |
| Volume on rallies | Increasing within range | Declining within range |
Then determine #1 vs #2:
| Criterion | Schematic #1 | Schematic #2 |
|---|---|---|
| Phase C trap | Spring / UTAD present | No trap — range completes without false break |
| Phase B length | Moderate | Often extended |
| Entry signal | Spring (acc.) or UTAD (dist.) | SOS / SOW directly |
Conclusion
The Wyckoff Schematics are not theoretical constructs — they are practical maps drawn from a century of market observation. They tell you, in advance, what a chart should look like if institutions are accumulating or distributing, and they give you a sequence of events to track so you always know where you are in the campaign.
Schematic #1 gives you the full structure including the Spring or UTAD trap — the most dramatic and recognizable version. Schematic #2 reminds you that the trap isn’t always present, and that patient volume analysis during Phase B can prepare you for an entry without one.
Master both schematics for both accumulation and distribution, and you will have a universal template for reading market structure across every asset class and every timeframe — exactly as Wyckoff intended when he first drew these blueprints nearly a century ago.

I’m Abdullah Shah, a content writer with three years of experience in crafting engaging and informative content. My background in market analysis complements my work, allowing me to create content that resonates with audiences. I’m also a seasoned practitioner in the forex and crypto markets, with a strong foundation and deep interest in finance. My passion for the financial world drives me to produce content that is both insightful and valuable for those interested in understanding market trends and financial strategies.