A normal price chart shows you one number at a time. But behind that single number sits a whole crowd of buyers and sellers, each waiting at their own price. Depth of market lets you see that crowd.
Traders call it by several names: DOM, Level 2, the order book, or the price ladder. They all describe roughly the same thing: a live view of the orders waiting above and below the current price.
In this guide, we’ll explain what depth of market is, how to read it, what it can and can’t tell you, and how beginners can use it without getting overwhelmed.
What Is Depth of Market?
Depth of market (DOM) is a real-time display of the pending buy and sell limit orders for an asset at different price levels.
It answers two simple questions:
- At what prices are people willing to trade?
- How much are they willing to trade at each price?
The word “depth” refers to how much volume sits in the book. A market with lots of orders at many prices is called deep. One with only a few small orders is called thin.
💡 Tip: The DOM shows intentions, not completed trades. Orders on it haven’t happened yet, and many never will.
Level 1 vs Level 2 vs Level 3 Data
Market data usually comes in layers. Here’s how they differ:
| Data level | What you see | Who typically uses it |
|---|---|---|
| Level 1 | Best bid, best ask, last price, and volume | Most casual investors |
| Level 2 | Several price levels above and below, with order sizes | Active traders, day traders |
| Level 3 | Everything in Level 2, plus the ability to enter and change quotes | Market makers and brokers |
Level 1 is the shop window. You see only the top price on each side.
Level 2 opens the door and shows the shelves behind it: the next five, ten, or more price levels and how much size waits at each.
Level 3 is the stockroom key. It’s mainly for professional firms that post quotes for others to trade against. Most retail traders never need it.
How a DOM Ladder Looks
Most trading platforms show depth of market as a vertical price ladder. Prices run down the middle, buy orders sit on one side, and sell orders on the other.
Here’s a simplified example:
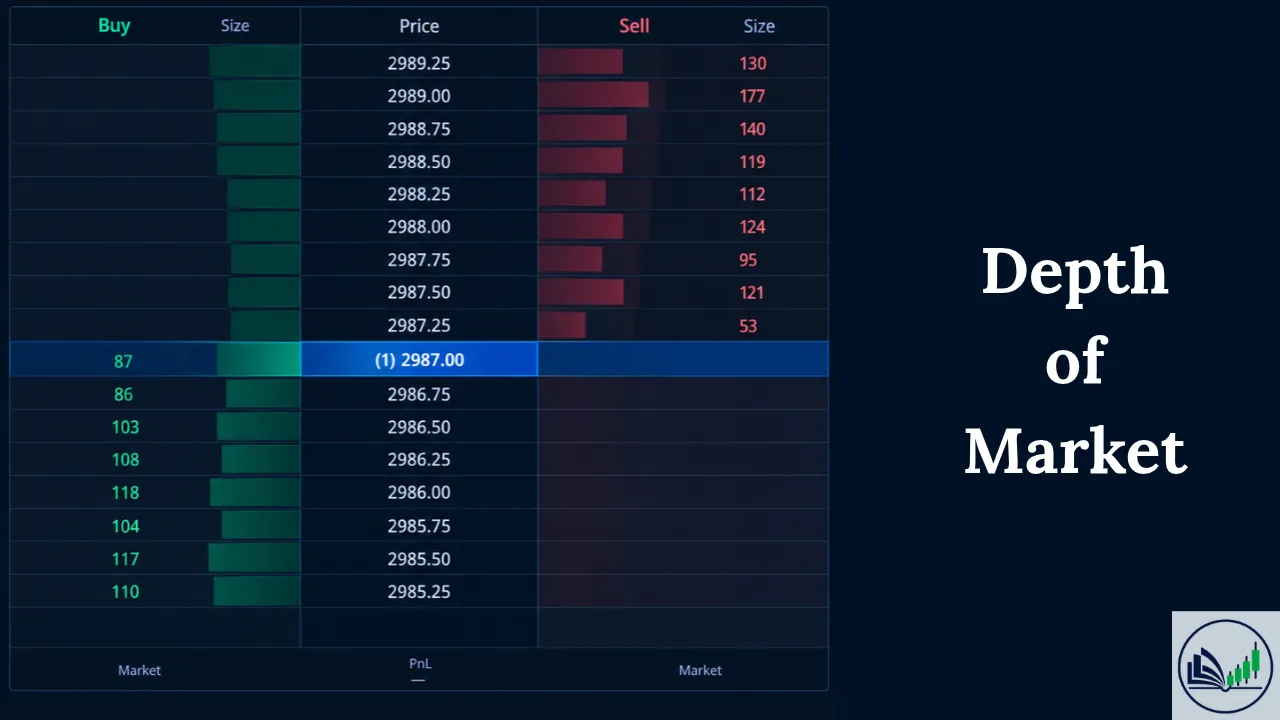
What this tells you:
- The best ask is 2987.25, with 53 units for sale.
- The best bid is 2987.00, with 87 units wanted.
- There’s a large group of sellers at 2989 (177 units).
- There’s a large group of buyers at 2986 (118 units).
Some platforms show this horizontally instead, as a table of bids and asks side by side. Crypto exchanges often add a market depth chart, a graph that looks like two hills sloping away from the current price, showing total buy and sell volume building up.
How to Read Depth of Market (DOM)
1. Find the Inside Market
Start with the best bid and best ask, the prices closest to the middle. This is where trading is happening right now.
2. Compare the Sizes
Look at how much volume sits on each side near the current price. If buyers show much larger size than sellers, there may be more support below than resistance above, at least for the moment.
3. Spot Buy Walls and Sell Walls
A wall is an unusually large order at one price. In our example:
- 2986.00 looks like a buy wall, a possible floor.
- 2989.00 looks like a sell wall, a possible ceiling.
Price often slows down or pauses near walls, because aggressive traders need to eat through all that size to push past.
4. Notice the Thin Areas
Gaps with very little size, like 2987.25 and 2987.50 in our ladder, are thin zones. Price can move through them quickly, because there’s little in the way.
5. Watch How Orders Change
The DOM is alive. Orders are added, cancelled, and filled every second. The real information often comes from how the book behaves, not from a single snapshot:
- Stacking: orders keep being added at a level, which shows growing interest.
- Pulling: orders vanish as price gets close, which suggests the interest wasn’t real or someone changed their mind.
💬 Quote: “Don’t fight the tape.” — Classic Wall Street maxim
Why Traders Use Depth of Market
Finding Short-Term Support and Resistance
Large resting orders can act as live, real-time levels, which is helpful for scalping and day trading.
Judging Liquidity Before Entering
If you plan to trade a large size, the DOM shows whether there’s enough volume at nearby prices to fill you without heavy slippage.
Precise Order Placement
Many platforms offer DOM trading or one-click trading, letting you place, move, or cancel orders directly on the ladder. This makes it fast to join a specific price level.
Reading Short-Term Pressure
When a big wall gets eaten quickly, it can signal strong aggression from the other side. When price repeatedly fails to break a wall, that side may be well defended.
💡 Tip: Pair the DOM with time and sales (the tape). The DOM shows what traders plan to do. The tape shows what they actually did. Together, they tell a much fuller story.
The Big Warning: Not Every Order Is Real
Here’s where many beginners get caught. The DOM can be misleading.
Spoofing
Spoofing is when someone places large orders they never intend to fill, just to scare or lure other traders. For example, a big fake sell wall might push nervous traders to sell, after which the spoofer cancels the order and buys cheaper. Spoofing is illegal in many regulated markets, but it still happens.
Iceberg Orders
An iceberg order does the opposite. It shows only a small visible piece of a much bigger order. Each time the visible part fills, a new piece appears. You might see “3000” on the ladder while thousands of units are actually waiting.
Hidden and Off-Exchange Orders
Some orders are fully hidden, and in stock markets a large portion of trading can happen away from the visible book entirely. So the DOM never shows the complete picture.
Speed of Change
Sizes can flip in milliseconds. Fast computer-driven traders constantly update their quotes, so what you see might already be outdated by the time you react.
💬 Quote: “Trust, but verify.” — Russian proverb, and excellent advice for reading the order book
💡 Tip: Be suspicious of a huge order that sits a few levels away and keeps moving as price approaches. Real buyers and sellers usually want to get filled; spoofers usually don’t.
Does Depth of Market Work in Every Market?
| Market | How useful is the DOM? | Why |
|---|---|---|
| Futures | Very useful | Central exchange, transparent order book |
| Stocks | Useful, but partial | Trading is spread across many venues; some is hidden |
| Crypto | Useful on each exchange | Each exchange has its own separate book |
| Spot Forex | Limited | No central exchange; you only see your broker’s or ECN’s liquidity |
For forex traders who want a cleaner view, some watch the related currency futures order book alongside their spot charts.
Pros and Cons of Using the DOM
Pros
- Shows real-time liquidity and market depth
- Highlights potential short-term support and resistance
- Helps avoid slippage on bigger orders
- Allows fast, precise order entry
Cons
- Orders can be fake, hidden, or cancelled instantly
- Can be mentally exhausting to watch
- Mostly useful for short timeframes
- Full Level 2 data may require a paid subscription
- Easy to over-read and overtrade
How Beginners Should Start With Depth of Market
- Learn on a liquid market. A popular futures contract or a high-volume stock gives cleaner, more reliable data.
- Watch before trading. Spend several sessions observing how the ladder behaves around big price levels.
- Mark levels from your chart first. Use the DOM to check what’s happening at those levels, not to find random trades.
- Track one behaviour at a time. For example, just watch walls and note whether they hold or get pulled.
- Use a simulator. Most platforms offering DOM trading also offer demo or replay modes.
- Keep position sizes small when you first trade live.
💡 Tip: Write down three things after each session: what walls you saw, whether they held, and what price did next. After a few weeks, patterns will start to jump out at you.
Final Thoughts
Depth of market pulls back the curtain on a price chart. Instead of a single number, you see the crowd of buyers and sellers waiting at every level, where they’re gathering, and where the path is clear.
Used wisely, the DOM can sharpen your entries, warn you about thin liquidity, and show short-term pressure as it builds. Just remember that orders are promises, not trades. Some are real, some are hidden, and some are pure bluff.
Treat Level 2 as a helpful lens, not a crystal ball. Combine it with your chart levels and the tape, keep risk small, and give yourself time to learn its language.

I’m Abdullah Shah, a content writer with three years of experience in crafting engaging and informative content. My background in market analysis complements my work, allowing me to create content that resonates with audiences. I’m also a seasoned practitioner in the forex and crypto markets, with a strong foundation and deep interest in finance. My passion for the financial world drives me to produce content that is both insightful and valuable for those interested in understanding market trends and financial strategies.