Table of Contents
In April 2025, Michael, widely known as ICT, discusses a refined intraday trading strategy known as the ICT Venom Trading Model. This trading model is specifically engineered for those who trade US stock index futures. This includes US 100 (NASDAQ), US30 (Dow Jones), and US500 (S&P 500).
This model offers a precision-based trading approach to capture daily price movements by using the concept of liquidity sweep, time and price theory, and institutional order flow.
Remember, ICT concepts, specially, venom model, are not just a pattern recognition setup. It is a framework highly rooted in the mechanics of how institutional traders manipulate liquidity in the early hours of the trading day. This article explores its core concept and its usage in bullish and bearish markets.
Understanding ICT Venom Trading Model
The word “Venom” is metaphorical. In this context, it represents how the institutions deceive retail traders. First, market attracts retail traders into trades through false sense of breakout or breakdown, and then reverse after capturing pool of liquidity.
This trading model is designed to grab such reversal opportunities. It is based on predictable sequence of price action that happens in the first 90 minutes of the New York trading session, specifically the window between 08:00 AM and 09:30 AM EST.
08:00 AM marks the beginning of electronic trading for US stock index future. During this time, the NYSE cash market has not opened yet. Institutions and smart money traders begin shaping the early narrative of the price action. The second timing is the official opening of the stock market. This is the high liquidity time for the market. Both institutions and retailers are participating in the market.
Coming back to the core concept of the model, a defined range is typically formed between these two time points. This range includes influential swing highs and lows. These swing points can be targeted as liquidity pools. Traders using the model capitalizes on the tendency of price to sweep this initial range just after the real opening.
Here comes the importance of having an understanding of the true directional bias of the market. Having a clear idea of weekly bias and daily bias help us in crafting true directional bias. So, after capturing liquidity, price reverse in alignment with true market structure.
Core Components of ICT Venom Trading Model
ICT Venom Trading Model is highly recommended to follow a structure sequence of ICT trading concepts that are necessary to use in venom model.
Identification of the Initial Range
This is the first step. In this step, you must observe the price action from 08:00 AM to 09:30 AM EST. Some traders call it a “Venom Box.” It is a defined price range where institutions set traps. In this range of price action, the highs and lows of this range are critical levels. These levels act as liquidity magnets during the 09:30 open.
Liquidity Sweep at the Open
After the official opening at 09:30 AM, price often makes a deceptive move. At first, it seems a genuine move because of volume surge and large candlesticks, but its purpose is to grab liquidity and induce traders in the wrong side of the market.
Price often breaks either above the highs or below the lows of the venom box. These price movements are intended to sweep liquidity. Remember, the price movements are not random in nature. It is an intentional liquidity grab by large institutional traders to fill their orders with retail stop-loss liquidity.
Shift in Market Structure
First two steps are important for understanding institutional intentions and narrative. This step is concerned with the confirmation of their narrative. After sweeping liquidity, it is advised to look for a change in market structure. It can be in the form of lower timeframe Change of character or Market Structure Shift (MSS).
The shift in structure confirms the intention of the reversal. As the model deals with intraday trading, observe the shift on the lower timeframes like 1-minute or 5-minute.
Trade Entry
After the reversal is confirmed, it is time for us to plan trade accordingly. It is advised to look for price to return to a fair value gap or Fibonacci-based OTE zone. The return to imbalance offers a high-probability entry point in the direction of the reversal. If trading with FVG, depending on market scenario (bullish or bearish), FVG occurs at a logical premium or discount level.
Profit Target and Risk Management
You can adjust your profit target depending on your risk management strategies and market conditions. Normally, it is advised to set your target from 50 to 80 ticks. However, you can target the near-by swing points for stop-loss and take profit.
Logic of Venom Trading Model
It is not about indicators or lagging tools. This model is based on market logic. There is a concept that institutions must create traps before executing their large order. The model discusses the same.
Institutions and smart money know that retail traders enter trades at the worst possible time. Their favorites timings are new spikes, breakouts, or volatile market opening. Institutions have the idea and they take advantage by inducing traders into poor entries, sweeping their stops, and then reversing price using that liquidity.
Venom Model in Bullish Market
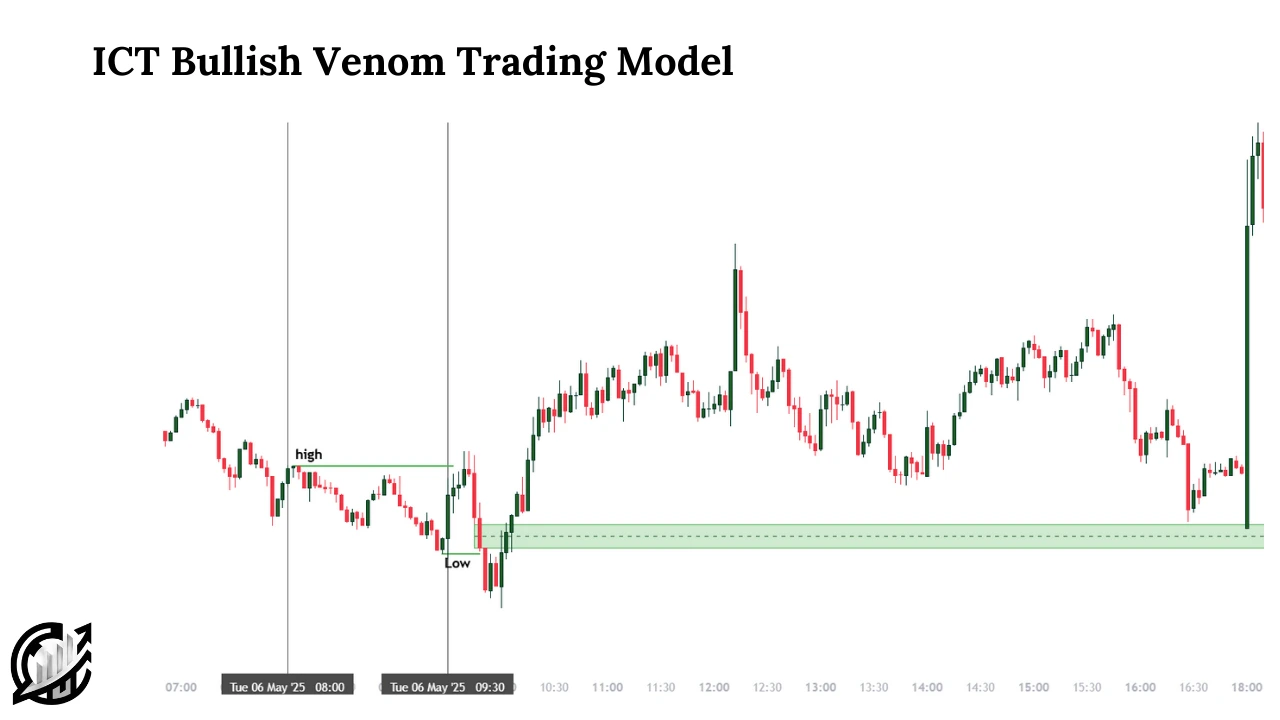
In bullish ICT venom trading model, market sweeps the low of the initial 90-minute range (from 08:00 AM to 09:30 AM EST) and then reverse sharply to the upside. This sweep is a form of liquidity engineering. It is a tactic used by institutional traders to capture stop-losses before moving the price in its intended direction.
Traders who understand the market structure patiently wait for liquidity sweep and profit from institutional movement.
Step-by-step breakdown
In first step, monitor price action from 08:00 AM to 09:30 AM. Mark the highs and lows during this time window. This 90-minute window is a zone of early liquidity. We have to wait for liquidity sweep.
In second step, wait for the official opening at 09:30 AM. This is a time when massive volume enters the market. Do not enter trades before 09:30 AM. The true move comes after the open.
In this third step, the setup begins to take shape. After the 09:30 AM, observe if the price moves below the low of the 90-minute range. This move is fast and sharp, and often considered as liquidity grab. This grab is the venomous part of the model.
In fourth step, we wait for the confirmation of the setup by marking ICT pd array. Price must break its structure to upside and often leaves behind a fair value gap or order block. In a bullish setup, the FVG will appear after the low has been swept and price starts reversing upward. The ideal FVG must align with discount zone.
In last setup, we take care of entry, stop-loss, and target. Place a buy limit within the FVG zone after the sweep, and stop-loss just below the liquidity sweep low. Target 50 to 80 ticks or use previous swing highs, session highs, or buy-side liquidity.
Venom Model in Bearish Market
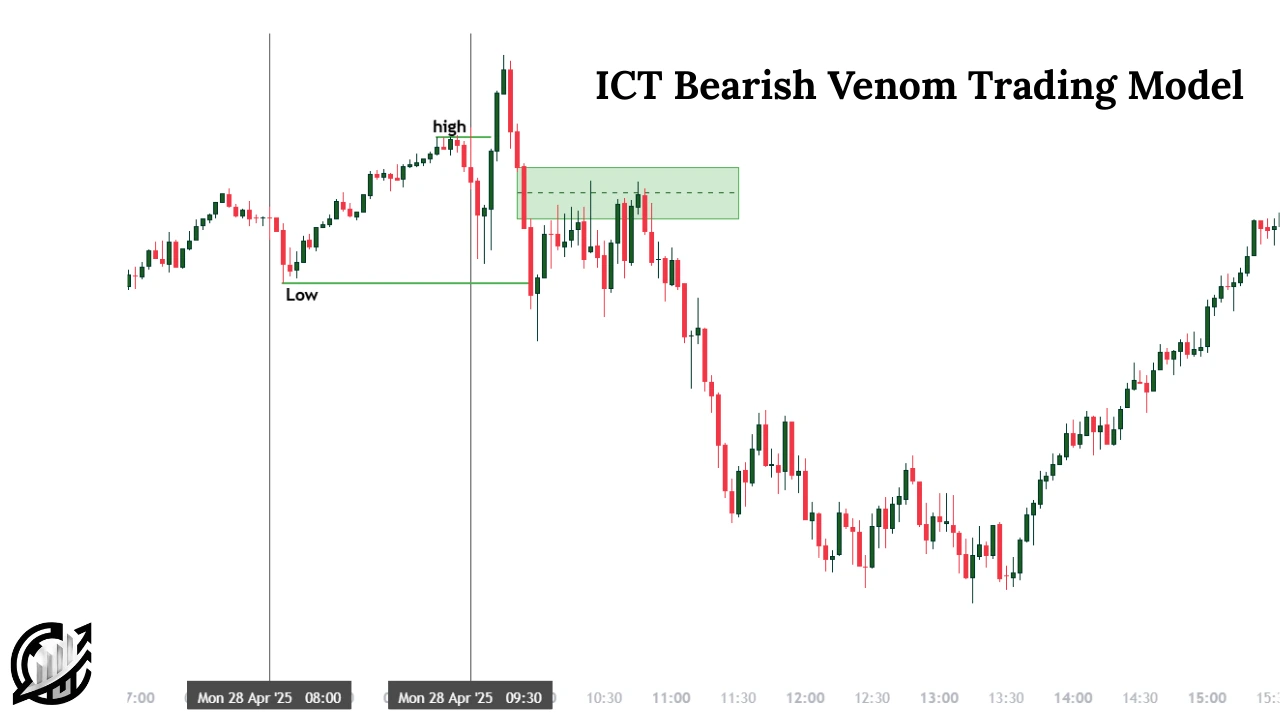
In bearish ICT venom trading model, market sweeps the high of the initial 90-minute range (from 08:00 AM to 09:30 AM EST) and then reverse sharply to the downside. This sweep is a form of liquidity engineering. It is a tactic used by institutional traders to capture stop-losses before moving the price in its intended downward direction.
Traders who understand the market structure patiently wait for liquidity sweep and profit from institutional movement.
Step-by-step breakdown
In first step, monitor price action from 08:00 AM to 09:30 AM. Mark the highs and lows during this time window. This 90-minute window is a zone of early liquidity. We have to wait for upside liquidity sweep.
In second step, wait for the official opening at 09:30 AM. This is a time when massive volume enters the market. Do not enter trades before 09:30 AM. The true move comes after the open.
In this third step, the setup begins to take shape. After the 09:30 AM, observe if the price moves above the high of the 90-minute range. This move is fast and sharp, and often considered as liquidity grab. This grab is the venomous part of the model.
In fourth step, we wait for the confirmation of the setup by marking ICT PD array. Price must break its structure to downside and often leaves behind a fair value gap or order block. In a bearish setup, the FVG will appear after the high has been swept and price starts reversing downward. The ideal FVG must align with premium zone.
In last setup, we take care of entry, stop-loss, and target. Place a sell limit within the FVG zone after the sweep, and stop-loss just above the liquidity sweep high. Target 50 to 80 ticks or use previous swing lows, session lows, or sell-side liquidity.
Final Note
This model offers a powerful and structured trading insights to intraday trading. According to the model, traders can anticipate institutional moves by focusing on liquidity sweeps and time-based precisions. Whether you are bullish or bearish, understanding the model can enhance your trading.
Remember, trading financial markets carry risk. It is advised to trade with the capital that you can afford to lose. Follow proper trading plan and risk management strategies. Mastering venom trading model can impact your trading but never guarantee success in trading.
Frequently Asked Questions (FAQs)
What is the ICT Venom Trading Model?
It is an intraday trading model developed by Michael J. Huddleston in April 2025. It is specifically designed for US stock index futures and focuses on exploiting liquidity sweeps and price inefficiencies.
Which Financial Assets does the ICT Venom Model apply to?
The model is specifically designed for US stock index future which includes US100 (NASDAQ Futures), US500 (S&P 500 Futures), US30 (Dow Jones Futures). It capitalizes on volatility and volume during the New York Trading Session.
What is the Initial Range and why it is important?
The initial range is formed between 08:00 AM and 09:30 AM. This range captures early liquidity and price positioning before the NYSE open. Venom model uses the high and low of this range to identify likely liquidity sweep points.
I’m Abdullah Shah, a content writer with three years of experience in crafting engaging and informative content. My background in market analysis complements my work, allowing me to create content that resonates with audiences. I’m also a seasoned practitioner in the forex and crypto markets, with a strong foundation and deep interest in finance. My passion for the financial world drives me to produce content that is both insightful and valuable for those interested in understanding market trends and financial strategies.