While learning SMC concepts, you have probably come across the term “BOS.” It appears in nearly every chart breakdown, every strategy video, and every trading forum discussion.
Analysis of Market structure helps traders to find out trending and trading ranges. There are potential opportunities in the market that need to be uncovered in both trending and trading ranges. In an ongoing trend (both uptrend and downtrend), traders find opportunities for trend continuation.
Break of Structure (BOS) confirms the continuation of the trend. Traders look for opportunities for trend continuation between swing high and swing low.
In this article, we will explain break of structure trading in plain, simple language. We will cover what a break of structure BOS actually is, how to spot one, and how it connects to other key ideas like market structure ICT and change of character (CHOCH).

Table of Contents
What is Break of Structure (BOS) in SMC Trading?
Bullish market moves by creating higher highs and higher lows. In a downtrend, the market moves by creating lower lows and lower highs. The market is fractal in nature and cannot move straight in one direction. Pullbacks and corrections are the reality of the market. SMC and ICT traders scrutinize each pullback and correction move in order to identify inducement in the range.
Break of structure (BOS) is basically the continuation of the trend. The Break of Structure aids in identifying market trends and provides opportunities to enter continuation trades. It signals potential trend continuation, enabling traders to align with the prevailing direction and capitalize on ongoing market momentum.
In simple terms, a break of structure happens when the price moves beyond a previous important high or low, confirming that the current trend is likely to continue.
In an uptrend, price creates a pattern of higher highs and higher lows. If price breaks above the most recent swing high (higher high) during an uptrend, that is a bullish BOS. In a downtrend, the market forms a lower low and lower high. If price breaks below the most recent swing low during a downtrend, that’s a bearish BOS.
In strong trending markets, favor the first BOS after a pullback rather than chasing a move that has already run far. Late entries after multiple consecutive BOS prints often carry a much higher risk of a reversal.
Why BOS Matters in SMC Trading?
When studying BOS in SMC trading, you’ll find that this concept traces back to older ideas from Dow Theory trend continuation, where analysts long thought that a trend remains valid until it is clearly broken. SMC and ICT traders built on this idea, adding modern tools like liquidity analysis to sharpen how the break is analyzed.
In BOS in ICT trading, a break of structure is rarely employed as a standalone signal to enter a trade. Instead, it acts as confirmation. It tells you which direction to focus on, helping you avoid the common mistake of fighting against the dominant trend. Once a bullish BOS forms, for example, traders usually shift their attention toward looking for buying opportunities rather than selling ones.
How to Identify Break of Structure (Step-by-Step)
Learning how to identify break of structure is a skill that improves with practice. Here’s a simple, beginner-friendly process you can apply to almost any chart.
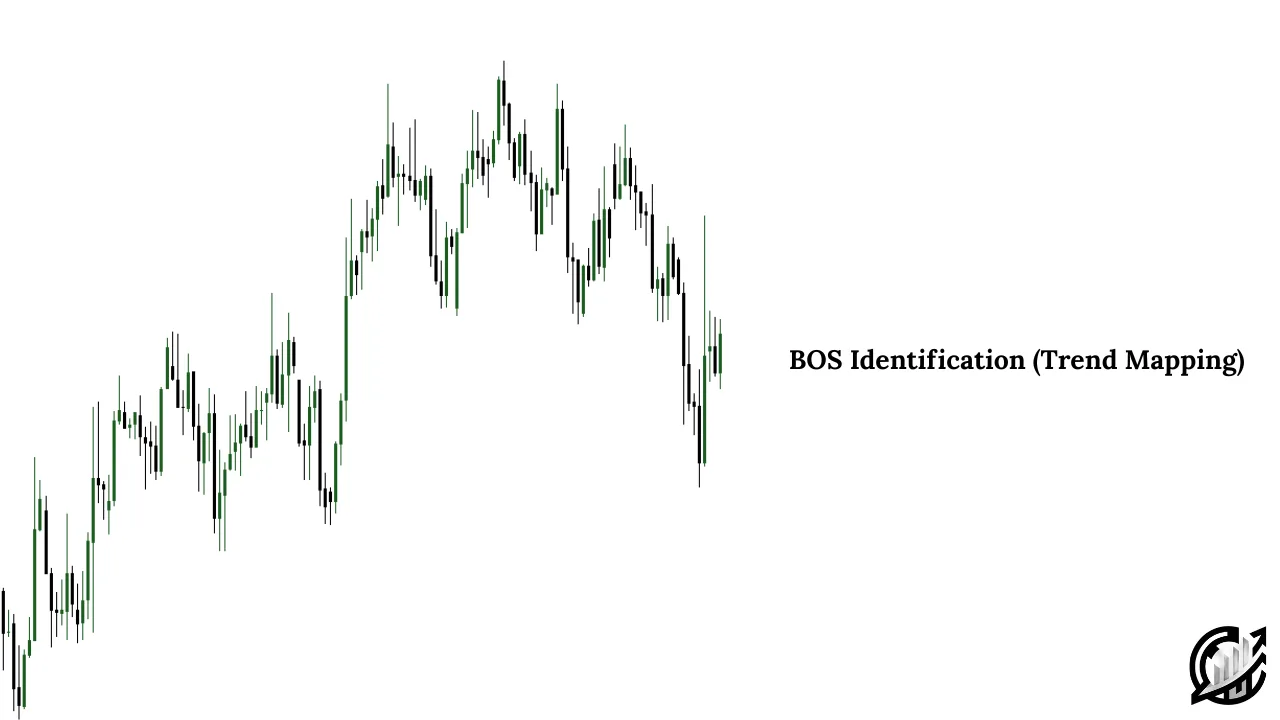
Step 1: Map the Current Trend
Look at the recent price action. Is the market forming higher highs and higher lows, or lower highs and lower lows? This tells you the direction you should expect a BOS to confirm.
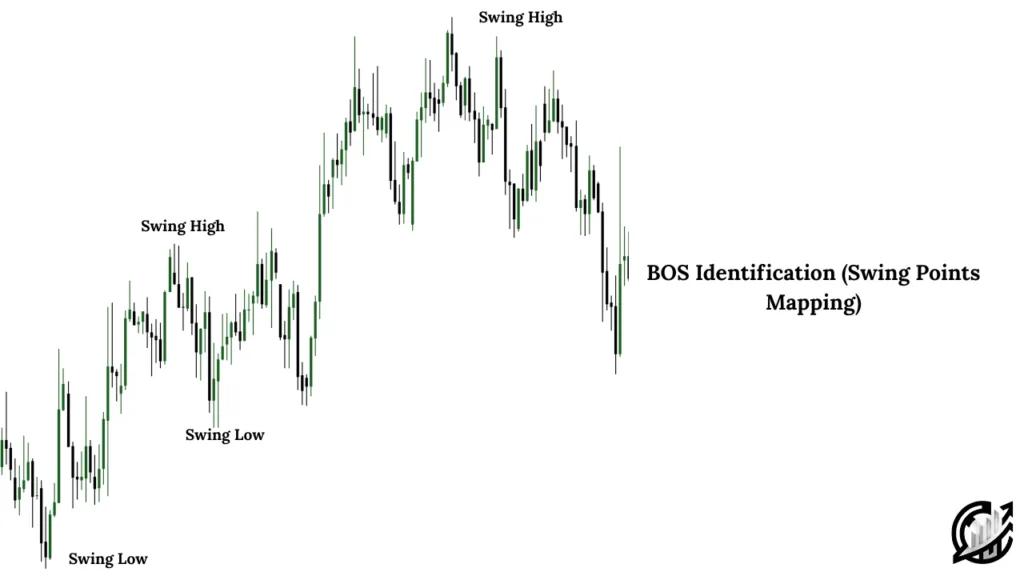
Step 2: Identify the Key Swing Point
Locate the most recent significant swing high (in an uptrend) or swing low (in a downtrend). This is the level the price needs to break through for a valid BOS to form.
Step 3: Watch for a Decisive Break
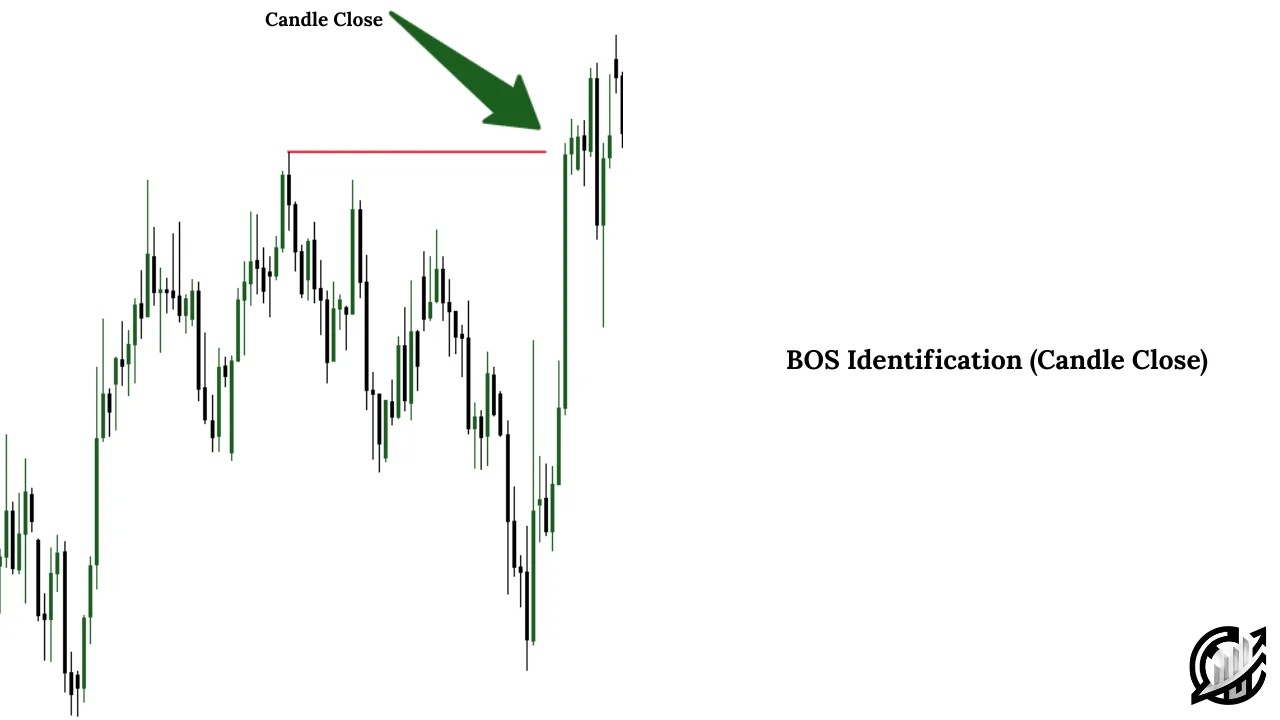
This is where many beginners get confused. A true break of structure requires a candle to close beyond the swing point — not just touch it with a wick. A brief wick through the level is often just a liquidity sweep, not a real structural break.
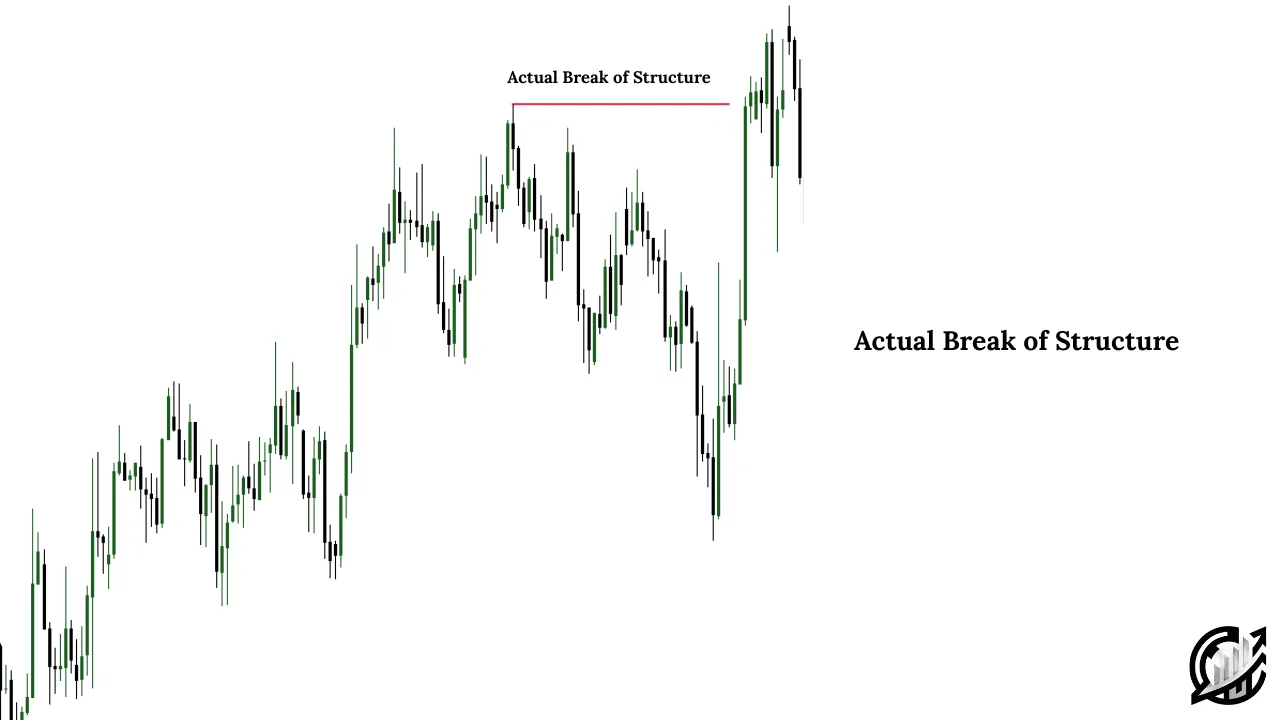
Step 4: Confirm the Direction
Once the candle closes beyond the key level, the break of structure is confirmed. In an uptrend, this means a new higher high has formed. In a downtrend, it means a new lower low has formed.
Step 5: Look for SMC Confluence
Strengthen your read of the market by checking for a displacement candle — a strong, fast-moving candle that often accompanies a genuine break. Many traders also look for a nearby fair value gap (FVG) left behind by this aggressive move, since it often becomes a useful reference zone later.
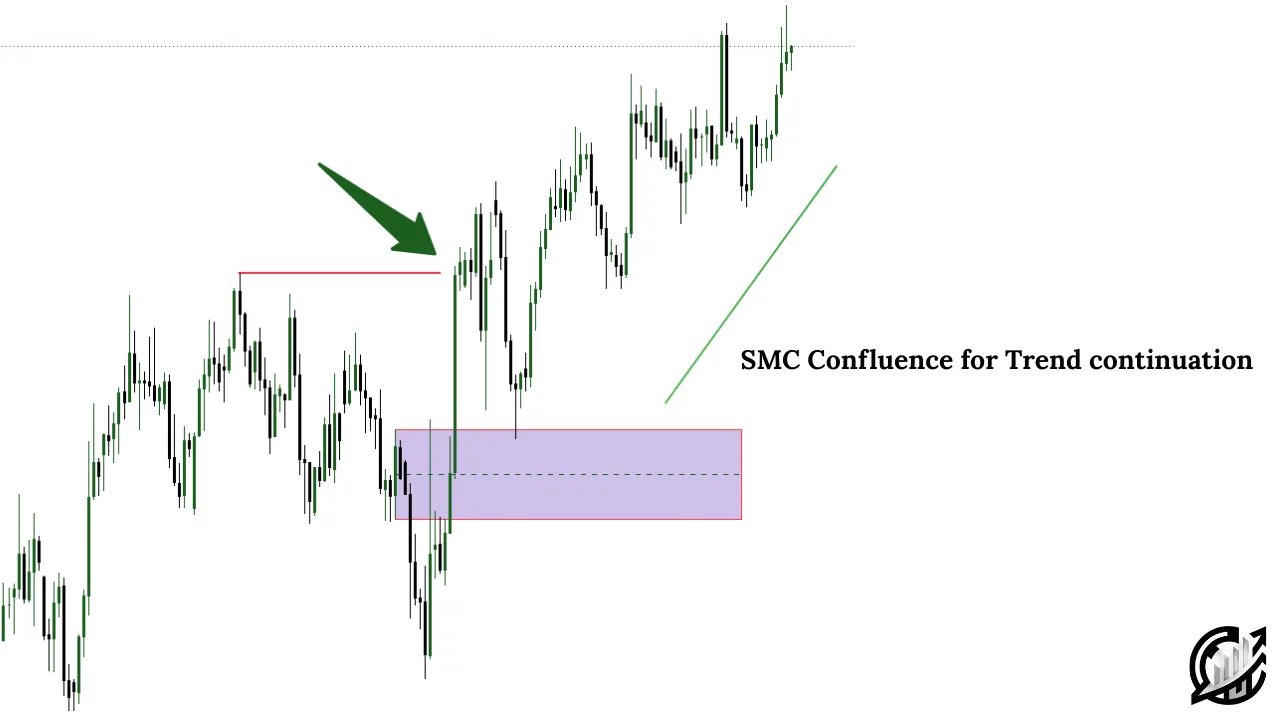
On lower timeframes (1-15 minutes), be extra cautious with internal structure breaks — they occur frequently and can trap traders who mistake short-term noise for a genuine trend confirmation.
Break of Structure in Uptrend (Bullish Market)
In a bullish market, the market continuously forms higher highs, meaning each new peak surpasses the previous one. This consistent breaking of prior highs indicates strong upward momentum, and this pattern is referred to as a bullish Break of Structure. It reflects the market’s ability to sustain its upward trajectory, with each new high confirming the strength of the ongoing trend.
Understanding market structure requires true identification of a Break of Structure (BOS). A bullish break of structure is incomplete without identification of inducement within the recent impulse move. The market grabs the inducement (Liquidity) and then continues its upward movement.
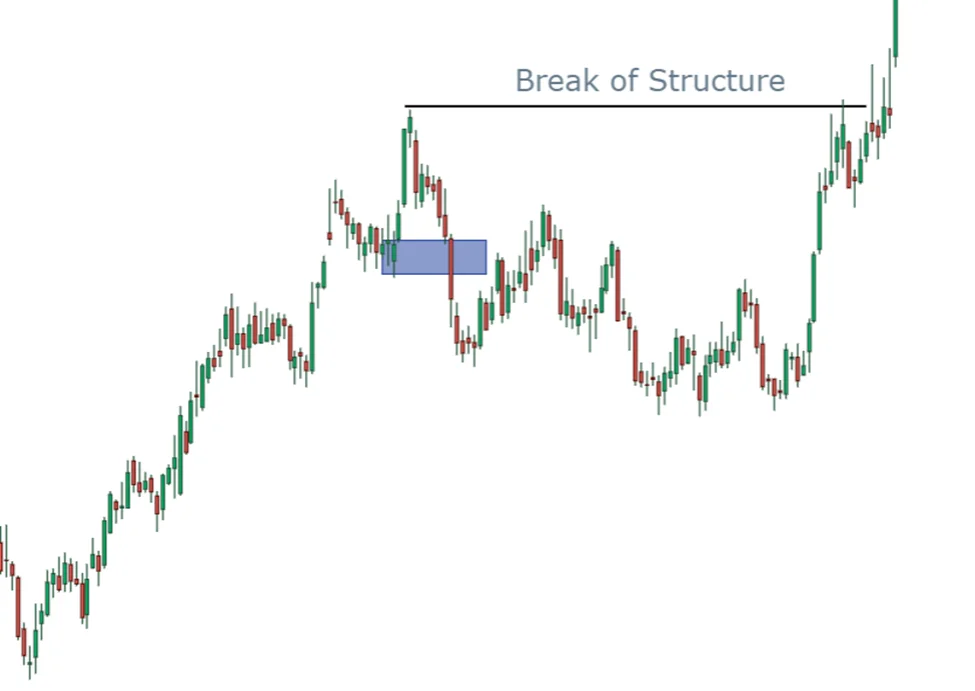
If the price breaks a previous high without taking inducement, it’s considered a minor Break of Structure. In this scenario, a new higher low isn’t established, leaving the overall market structure unchanged. The minor break suggests a temporary move rather than a significant trend continuation, indicating that the underlying bullish structure remains intact despite the brief price action.
Real market example of a break of structure with inducement being grabbed.
Trading With Bullish Break of Structure
Trading continuation of the trend requires understanding of market structure and trend context. We can trade a bullish break of structure in the following way:
- In a bullish market, the price forms higher highs and higher lows. This indicates a strong uptrend. A BoS occurs when the price breaks above a previous high, signaling continued bullish momentum.
- After BOS, we can mark our first pullback or other liquidity zone as an inducement zone. The market may approach the zone and grab liquidity. Inducement refers to a price level that entices traders into taking positions, often leading them into traps. When the market breaks a structure and creates a new high, it might leave behind unfilled orders or liquidity at certain levels, often below the most recent pullback.
- After marking the inducement, wait for the price to retrace back to this level. This retracement often occurs because the market seeks to fill unfilled orders or grab liquidity left behind.
- Once the price grabs the inducement, you can start looking for buy trades. However, it’s essential to confirm the entry using additional signals. Look for a shift in market structure, such as the formation of a higher low on a lower time frame, which indicates the resumption of the bullish trend.
Example of Bullish BOS
In this example, the market is clearly in an uptrend by forming higher highs and higher lows. It is a classic sign of bullish market structure. The decisive break above the previous swing high confirms bullish momentum.
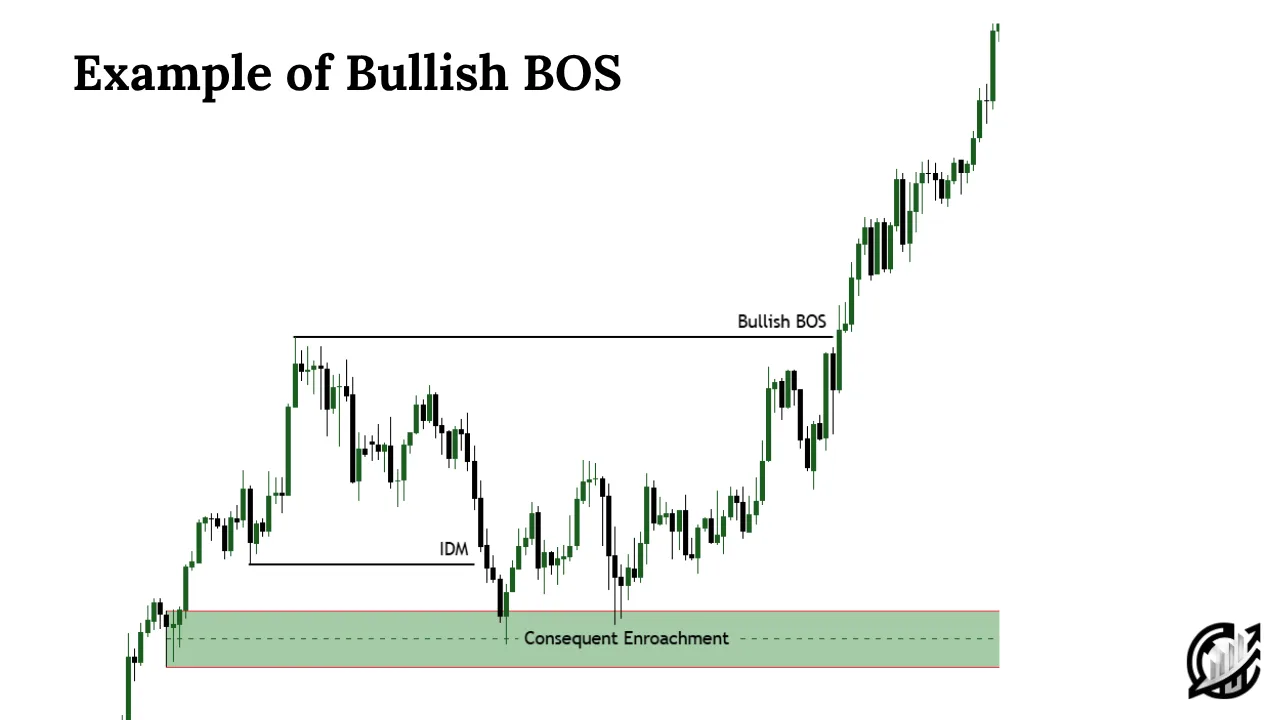
After the bullish break, the market enters a correction phase. This is because after a liquidity above a weak high, the market reverses its direction to the downside. This pullback state can never be considered a reversal.
During this retracement, the market breaks its most recent minor low. SMC traders refer to this as an inducement. This inducement is a trap for traders who enter early. The purpose is to entice retail traders.
After taking liquidity, the market taps into an order block (OB) within the discount range. In this case, it is a single-candle order block.
Now notice something important here: the market resumes its bullish rally precisely from the 50% level of that order block. This midpoint of the OB is known as consequent encroachment. It marks the equilibrium level within the order block.
This bullish BOS setup presents how multiple SMC tools align to create high-probability institutional entry.
Break of Structure in Downtrend (Bearish Market)
In a bearish market, the market continuously forms lower lows and lower highs, meaning each new low surpasses the previous one. This consistent breaking of previous lower lows indicates strong downward momentum, and this pattern is referred to as a bearish Break of Structure. It reflects the market’s ability to sustain its downward trajectory, with each new low confirming the strength of the ongoing trend.
Understanding market structure requires true identification of Break of Structure (BOS). A bearish break of structure is incomplete without identification of inducement within the recent downward move. The market grabs the inducement (Liquidity) and then continues its downtrend movement.
If the price breaks a previous lower low without taking inducement, it’s considered a minor Break of Structure. In this scenario, a new lower high isn’t established, leaving the overall market structure unchanged. The minor break suggests a temporary move rather than a significant trend continuation, indicating that the underlying bearish structure remains intact despite the brief price action.
Trading with Bearish Break of Structure
We can trade the bearish continuation in the same way:
- In a bearish market, the price generally makes lower highs and lower lows, reflecting a downtrend. A BoS occurs when the price breaks below a previous low, indicating continued bearish momentum.
- Similar to a bullish market, after a structure break, certain price levels may act as inducements where the price could retrace. These are often levels above the most recent lower high, where liquidity or unfilled orders exist. Mark these levels as inducement zones, as they are likely areas where the price will retrace before continuing its downward movement.
- After marking the inducement zone, wait for the price to retrace back to this level. The retracement is the market’s way of grabbing liquidity before continuing its downward trend. When the price retraces and grabs the inducement, it’s a strong indication that the bearish trend is ready to resume.
- Once the price grabs the inducement, you can look for sell trades, but like in the bullish scenario, you need confirmation. Look for a shift in market structure on a lower time frame, such as the formation of a lower high, indicating the continuation of the bearish trend.
Example of Bearish BOS
In this example, the market is clearly in a downtrend by forming lower lows and lower highs. It is a classic sign of bearish market structure. The decisive break below the previous swing low confirms bearish momentum.
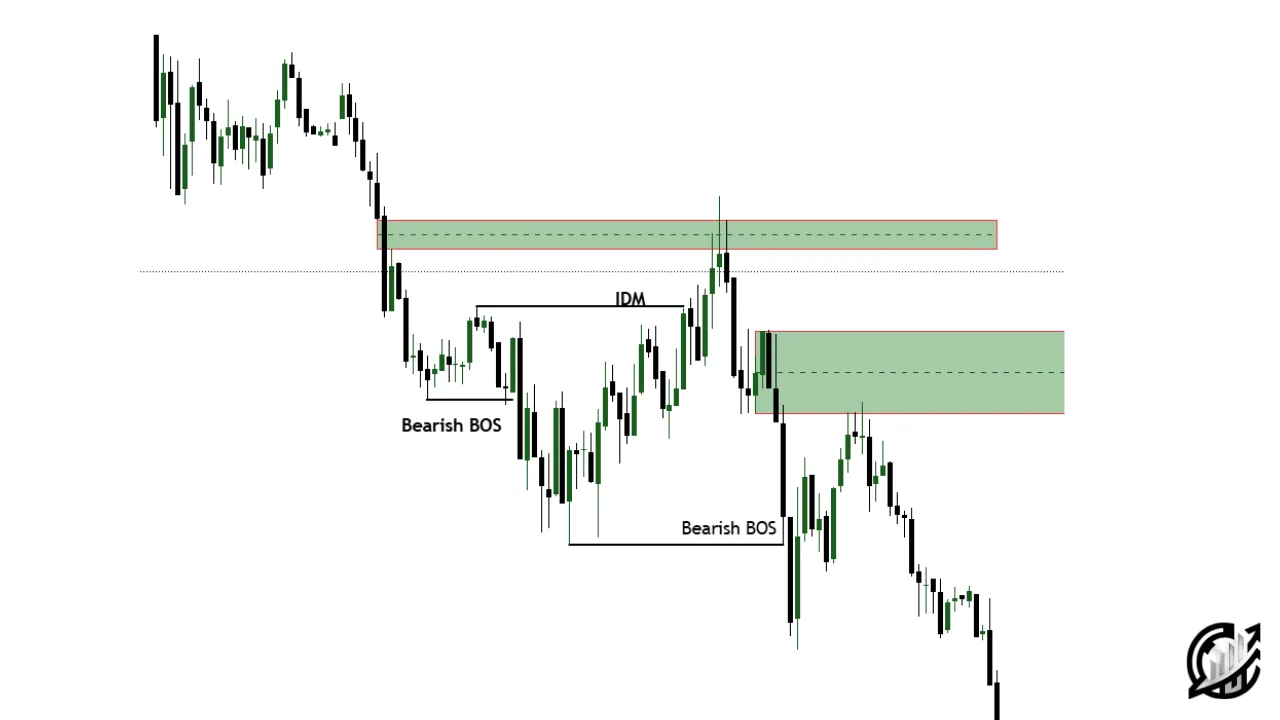
After the bearish break, the market enters a correction phase. This is because after a liquidity move below a weak low, the market reverses its direction to the upside. This pullback state can never be considered a reversal.
During this retracement, the market breaks its most recent minor swing high. SMC traders refer to this as an inducement.
After taking liquidity, the market taps into a fair value gap within the premium range.
Common Mistakes Beginners Make
- Trusting wicks over closes. A wick beyond a swing point is not a confirmed BOS — always wait for the candle to close.
- Treating every internal swing as a major BOS. Smaller timeframes often produce frequent, minor structure breaks that don’t reflect the bigger trend.
- Entering immediately after a BOS. Remember, BOS confirms direction — it isn’t an entry signal by itself.
- Ignoring risk-to-reward BOS trading principles. Even a textbook BOS setup needs a sensible stop loss and target to be worth trading.
Using Tools and Indicators for Faster Analysis
If manually tracking swing points feels overwhelming at first, that’s completely normal. Many traders rely on a BOS indicator TradingView script, or similar ICT structure indicator MT4/MT5 tools, to automatically highlight structure breaks on the chart. These tools are useful time-savers, but they work best when paired with genuine understanding — knowing why a level matters is more valuable than simply seeing a label appear on your chart.
Final Note
In trading, understanding Break of Structure and inducement is crucial for strategic entries. However, these concepts should be used alongside thorough analysis and confirmation signals. Always consider the risk of false signals and unexpected market movements. Trading involves significant risk, and it’s essential to use proper risk management strategies, such as setting stop-losses and position sizing, to protect your capital. Only trade with money you can afford to lose.
Frequently Asked Question (FAQs)
How does inducement relate to Break of Structure?
After a BoS, the price often retraces to an inducement zone where unfilled orders or liquidity are located. This retracement is typically a precursor to the continuation of the trend, providing an opportunity for traders to enter the market.
What time frames are best for observing BoS and inducement?
BoS and inducement can be observed on various time frames. Higher time frames (daily, 4-hour) provide stronger signals, while lower time frames (1-hour, 15-minute) are useful for confirming entries and finding precise trade setups.
Is it necessary to wait for price retracement to the inducement zone?
While waiting for a retracement to the inducement zone increases the probability of a successful trade, it’s not always necessary. Some traders may choose to enter after a strong BoS with other confirming factors, but this approach carries higher risk.

I’m Abdullah Shah, a content writer with three years of experience in crafting engaging and informative content. My background in market analysis complements my work, allowing me to create content that resonates with audiences. I’m also a seasoned practitioner in the forex and crypto markets, with a strong foundation and deep interest in finance. My passion for the financial world drives me to produce content that is both insightful and valuable for those interested in understanding market trends and financial strategies.