The financial markets are not driven by retail traders with small accounts. They are moved by the colossal buying and selling activity of banks, hedge funds, central banks, and large financial institutions.
These players move billions of dollars at a time, and because their orders are so large, they cannot be executed all at once. Instead, they enter and exit the market in stages, leaving behind subtle but traceable footprints on price charts. ICT institutional order flow is the methodology for reading those footprints.

Table of Contents
Although this method’s origins are in floor trading, it has developed with electronic markets to provide more accurate and instantaneous transactional data analysis.
ICT Institutional Order Flow: Meaning and Definition
The ICT institutional order flow refers to the directional stream of buy and sell orders entering the market from institutional participants – including commercial banks, investment, central banks, hedge funds, and algorithmic trading desks.
These orders collectively determine the momentum, direction, and structure of price in any financial market, from forex pairs to commodities and indices.
In the ICT framework, order flow is not analyzed through a traditional order book or DOM (Depth of Market). Instead, traders can read it directly from the price chart using candlestick patterns.
The ICT order flow is precise: order flow is represented by the corrective candles that form against the primary trend direction, immediately before or after a break in market structure (trend continuation). These candles mark the zones where institutions are quietly accumulating or distributing large positions.

This definition sets ICT order flow apart from conventional order flow analysis, which relies on volume data and tick charts. The ICT approach is purely price action and time-based. This makes it accessible on any platform and applicable across all timeframes and markets.
How ICT Institutional Order Flow Works?
To understand how institutional order flow works in the ICT context, you must first understand one foundational concept: institutions cannot fill their enormous order in a single transaction.
If a major bank needs to buy one billion dollars worth of EUR/USD, executing that order in a single block would move the market dramatically, and result in an unfavorable average price. Instead, institutions accumulate their positions gradually – entering in stages during price retracements.
This is where corrective candles within a trend becomes significant. When the market is in an uptrend and price pulls back temporarily, those pullback candles are not just random noise.
These are the candles during which smart money is quietly buying. ICT/SMC traders identify these specific zones as order flow areas, because they reveal exactly where institutional demand is being built.
To identify ICT order flow correctly, you must first locate a Break of Structure (BOS). The BOS is the moment price breaks decisively above a previous swing high (bullish BOS) or below a previous swing low (bearish BOS). The corrective candles that formed just before the BOS become the order flow.
Bullish Order Flow: Definition and Identification
The bearish candlesticks (pullback) that emerge during a bullish trend just before a break of structure takes place are referred to as bullish order flow. The bearish candlesticks indicate a brief pullback, during which smart investors are building up their investments in hopes of further gains.
These declines serve as a crucial area of price support and indicate a possible buying opportunity for traders. The price validates the support given by the bearish retracement candlesticks and confirms the continuance of the bullish order flow as it breaks the previous high and starts its upward journey.
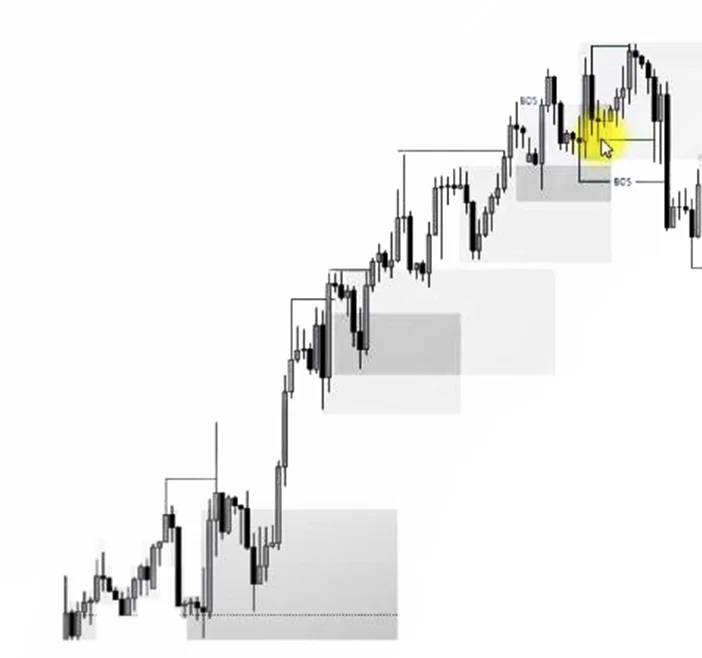
If there is a single bearish candle pullback in a bullish order flow scenario, that single candle can be identified as the order flow. If pullback is comprised of multiple candlesticks, all the pullback candlesticks are referred to as order flow zone This sector is a good representation of where smart money is probably establishing positions.
Bullish Order Flow Signal: When the price retraces back into the bullish order flow zone, look for a market structure shift on a lower timeframe. A bullish MSS within the zone is your entry confirmation to go long.
Order Flow zone is of interest to traders because it provides support for possible buy entries, and traders believe that after the retreat is over, the price will resume its bullish trajectory. The order flow zone turns into a crucial stage for upcoming market responses.
Bearish Order Flow: Definition and Identification
Bearish Order Flow is the bullish candlesticks (pullback) that appear before a break of structure during a bearish trend. These bullish candlesticks indicate brief upward movements, which give institutions the opportunity to build up sell positions even as the general market trend continues to decline. As a possible resistance zone where price is likely to pause before continuing its bearish trend, this pullback area is crucial for traders.
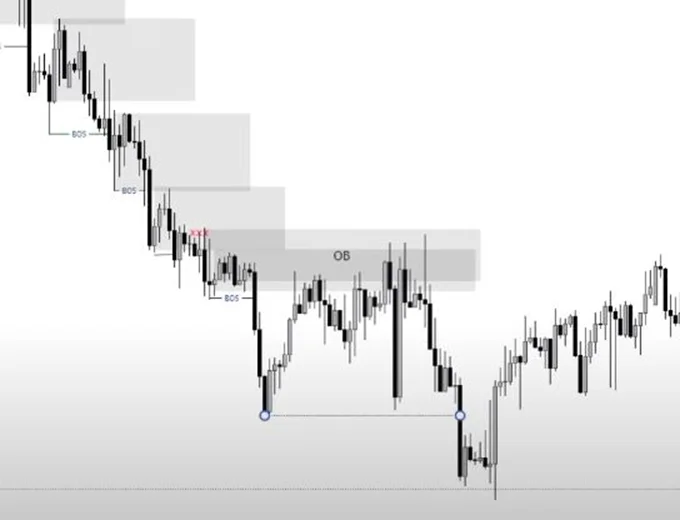
If there is only one candlestick as pullback, that candle can be referred to as bearish order flow. However, if there are multiple bullish candlesticks, all of them are referred as bearish order flow zone. This zone is representative of a larger institutional activity region where smart money is probably setting up to take advantage of additional downward volatility.
ICT Order Flow Trading Strategy: Step-by-Step Guide
The ICT order flow trading strategy is a structured, rules-based process that aligns retail trader entries within the positioning of smart money. Here is how to execute it effectively.
Establish Higher Timeframe Directional Bias
Begin on daily or four-hour chart and determine whether the market is in a bullish or bearish structure. In a Bullish structure, you are looking for bullish order flow zones to buy from. In a bearish structure, you focus on bearish order flow zones to sell from.
Identify the Break of Structure (BOS)
Locate the most recent BOS on your chosen timeframe, a decisive break above a swing high (bullish) or below a swing low (bearish). The corrective candles immediately before that BOS form your order flow zone.
Wait for Retracement into the Order Flow Zone
Do not enter trades at the moment of the BOS. Instead, wait for price to retrace back into the marked order flow zone. This is where institutions re-enter their positions. Patience is critical.
Lower Timeframe Confirmation
Once the price enters the order flow zone, shift to a lower timeframe (15-minute or 5-minute). Look for a market structure shift in the direction of the higher timeframe trend. A bullish MSS within a bullish order flow zone confirms institutional buying. A bearish MSS within a bearish order confirms institutional selling.
Execute the Trade
Enter the trade following the MSS confirmation. Place your stop-loss below the order flow zone low (for longs) or above the zone high (for shorts). Identify your take-profit levels using the next structural high or low.
Risk Reminder: Not every order flow zone produces a clean reaction. Always use confluence. Align your order flow zones with ICT kill zones (London Open, New Yor Open), Order Blocks, or Fair Value Gaps for the highest probability setups. Never risk more than 1 – 2% of account capital per trade.
Order Flow Trading Example
Here is a practical order flow example to illustrate the full strategy in action. The EUR/USD pair is in a clear downtrend on the one-hour chart, making lower lows and lower highs. The directional bias is clearly bearish.
On the one-hour chart, price makes sharp down move by breaking swing lows. Over the several hours, price makes a new swing low and then retraces and from one bullish candle, which also killed the previous strong bearish candle high.
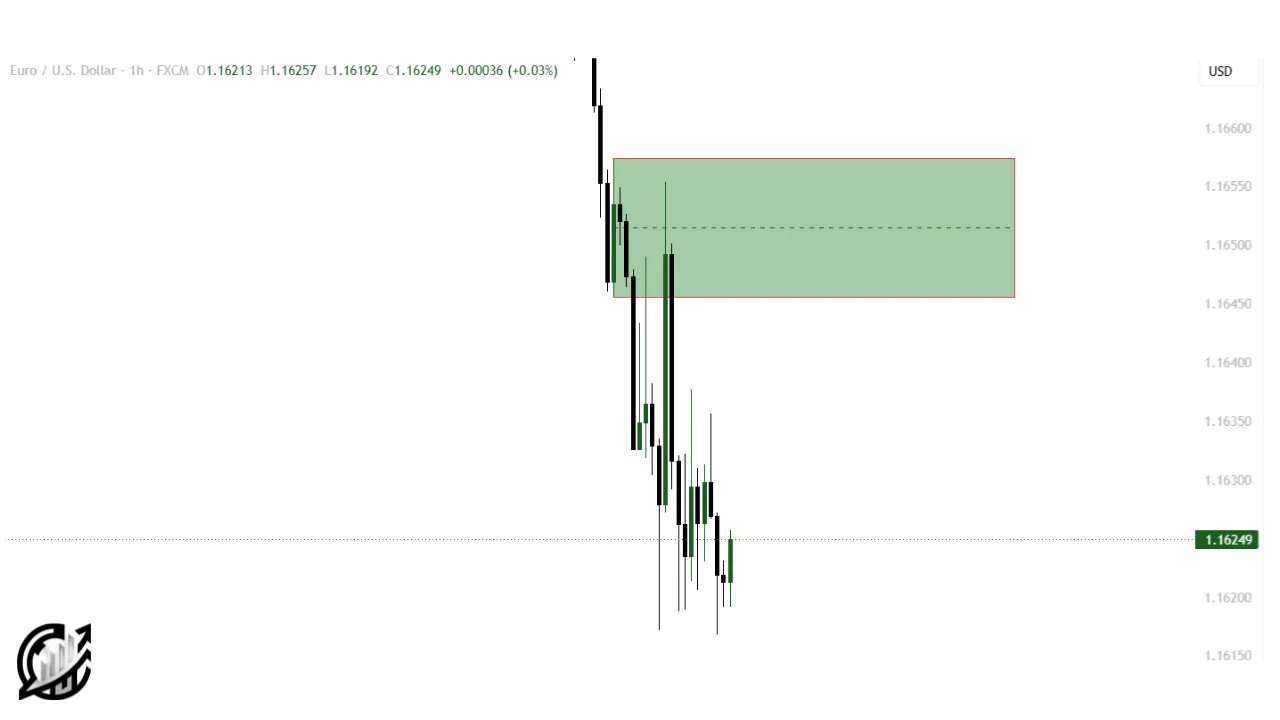
The bullish candle in this move is an important bearish order flow zone. After that price makes series of bearish candles. After making new lows price reverses and visits to the order flow zone.
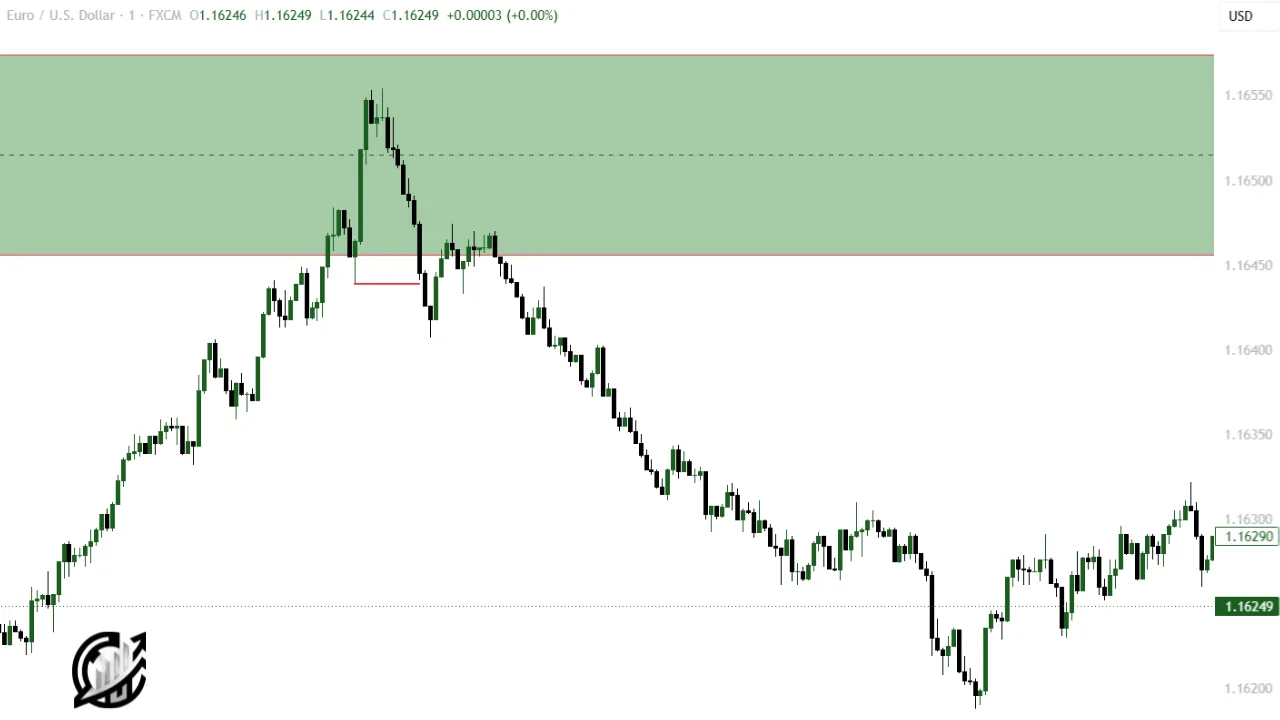
Candle body close remains below the consequent encroachment which is a sign that price will continue its prior trend. Price then continues in its intended direction.
Price on Lower timeframe breaks the recent swing low (a sign of MSS). The retracement is weak and price continues downward direction from the breaker block.
Final Note
ICT institutional order flow is one of the most powerful framework available to retail traders. By shifting your perspective from indicator-based trading analysis to the actual mechanics of how institutions move and accumulate positions, you gain a structural understanding of price that most retail traders never develop.
Mastering ICT institutional order flow takes time and consistent practice on live charts. However, internalizing the concept helps tracking smart money footprints.
Risk Disclaimer: Although, ICT trading concepts provide much deeper insights related to trading, but it does not guarantee success in trading. As a trader you must follow risk management strategies and place stop-loss in you trading,

I’m Aatiq Shah, a dedicated forex and crypto market practitioner with three years of hands-on experience. Currently, I’m working as a Financial Manager. My journey in the world of finance has equipped me with the skills and knowledge needed to navigate the complexities of the forex and crypto markets.