Before there were indicators, oscillators, moving averages, or algorithmic signals, supply and demand were the forces that have governed prices in every financial markets.
In Wyckoff SMC trading framework, supply and demand zones are not vague areas drawn around peaks and troughs. They are precise, institutionally-defined price regions where institutions place massive buy and sell orders at a specific moment in time.
Technically, those orders are too large to fill at once, so unfilled portions remain pending at those price levels. When price returns to the zone, those pending institutional orders are triggered again.

Table of Contents
Understanding how to identify, classify, and trade supply and demand zones in SMC is one of the highest-impact skills a retail trader can develop. This guide covers from intermediate to advance supply and demand zone trading.
Core Principle: In SMC, Supply Zones are institutional selling areas. Price visits these areas and falls. Demand zones are institutional buying areas. Price visits to the demand zones and rises. The sharper and faster the departure from the zone when it first formed, the stronger the zone is likely to be on the next retest.
Supply and Demand Zone: Meaning and definition
A supply zone is a price range on chart where selling pressure is – or was – so strong that price departed from that level rapidly and decisively to the downside Within the SMC framework, supply zones represent areas where institutional sellers placed large sell orders, creating a surplus of supply that reduces buyer demand.

A demand zone is the mirror concept. It is a price range where buying pressure was so strong that price departed rapidly to the upside. Institutional buyers accumulate long positions at these levels, creating a flood of demand that absorbed all available selling and continue price higher.
Just like supply zones, demand zones act like institutional magnets. Price often returns to these zones and fill the unfilled orders.

The critical distinction between SMC supply and demand zones and traditional support and resistance is this: S/D zones in SMC have a clearly identified origin. The exact price action that created them is visible and traceable on the chart.
Supply and demand zones are not drawn horizontally across multiple touchpoints like traditional S/R. Instead, they are identified from a single explosive departure point.
S/D vs S/R: Traditional support and resistance are horizontal line drawn at repeated price touchpoints. SMC supply and demand zones are forward looking areas identified from a single explosive price departure – the institutional origin event.
Supply Zone vs Demand Zone: Side-by-Side Comparison
The table below maps every characteristic of supply and demand zones in SMC.
| Feature | Supply Zone | Demand Zone |
| What it represents | Where institutions sold aggressively | Where institutions bought aggressively |
| Price behavior | Price drops sharply when leaving zone | Price rises sharply when leaving zone |
| Location on chart | Above current price (premium area) | Below current zone (discount zone) |
| Market context | Top of a swing / bearish structure | Bottom of a swing / bullish structure |
| How to trade | Enter short on zone retest | Enter long on zone retest |
| Stop-loss placement | Above the top of the supply zone | Below the bottom of the demand zone |
| Invalidation | Price closes through the zone | Price closes through the zone |
| SMC confluence tools | Bearish FVG, bearish OB, Premium zone | Bullish FVG, bullish OB, discount zone |
Bullish Supply and Demand Zone Trading: Trading Demand Zones
In bullish market structure, demand zones are the strategic entry points that SMC traders use to join the uptrend at institutional prices rather than chasing the market at the top.
How to Identify a Valid Bullish Demand Zone
A valid demand zone forms from a sharp, impulsive bullish departure. Look for a cluster of candles (the base) that consolidates within a tight range, immediately followed by a strong bullish displacement candle that breaks above a previous swing high (break of structure). The base candles are the demand zone. Mark the entire range from the lowest low of the base to the highest high of the base. That rectangle is your institutional demand zone.
There are several conditions must be met before considering the zone strong and worth trading. The departure move must be impulsive. It simply means that two or three very large bullish candles that leave FVG and break clear structural levels.
The base of the demand zone itself must be tight and the zone must be fresh meaning that price has not yet returned to retest it since the initial departure. A demand zone that has already been retested and bounced from multiple time is a weaker zone than one that has never been touched since its formation.
Bullish Entry Setup: Wait for price to retrace into the demand zone from the above. As the price enters the zone, look for a bullish confirmation signal on the lower timeframe – a Market Structure Shift (MSS), a Fair Value Gap retest, or a bullish rejection candle. Enter long. Stop-loss below the zone’s lowest wick. Target the previous swing high or the next institutional draw on buy-side liquidity.
Bearish Supply and Demand Trading: Trading Supply Zones
Market is viewed to be in bearish mode when creating lower lows and lower highs. In this market scenario, supply zones serve as the institutional selling areas where smart money adds to or initiates short positions during upward retracements.
How to Identify a Valid Bearish Supply Zone
A supply zone forms from a sharp, impulsive bearish departure. Identify the base candles and mark their range from lowest low to highest high. The base is where institutional sellers were quietly positioning before driving price lower. The strong bearish departure that followed their entry and left unmitigated supply orders in that zone.
In order to label the supply zone as valid, the departure move must be powerfully bearish and leave observable FVGs, the base must be compact, and the zone must be fresh. In bearish market structure, supply zone sit within the premium range making them naturally aligned with the institutional sell bias.
Bearish Entry Setup: Wait for the price to retrace into the supply zone. On the lower timeframe, look for a bearish MSS, a bearish FVG retest inside the zone, or a strong bearish rejection candle. Enter short. Stop-loss above the supply zone’s highest point. Target the previous swing low or the next institutional draw on liquidity.
Common Supply and Demand Patterns in SMC
SMC traders have identified six structural patterns that produce supply and demand zones. Each pattern has a distinct formation mechanic and a specific trading application.
RBD
Rally-Base-Drop is a supply zone. In market structure framework, it is a reversal trading pattern. It forms when price rallies, consolidates in a tight base, and then drops sharply away. The base candles form the supply zone. The pattern is best for short entries on zone retest.

DBR
Drop-Base-Rally is a demand zone. In market structure framework, it is a reversal pattern. It forms when price drops, forms a tight consolidation (base), then rallies sharply upward. The base candles form the demand zone. The pattern is best for long entries on zone retest.

RBR
Rally-Base-Rally is a demand zone. In market structure framework, it is a bullish continuation pattern. It forms when price rallies, pauses in a base, then continues the rally (bullish price movement). The base is continuation demand zone. The pattern is suitable for framing long trade when price retest the zone.

DBD
Drop-Base-Drop is a supply zone. In market structure framework, it is a bearish continuation pattern. The pattern forms when price drops, consolidates, and continues dropping. The base is a continuation supply zone. The pattern is suitable for framing bearish trade setups when price retest these zones.

Flip Zones
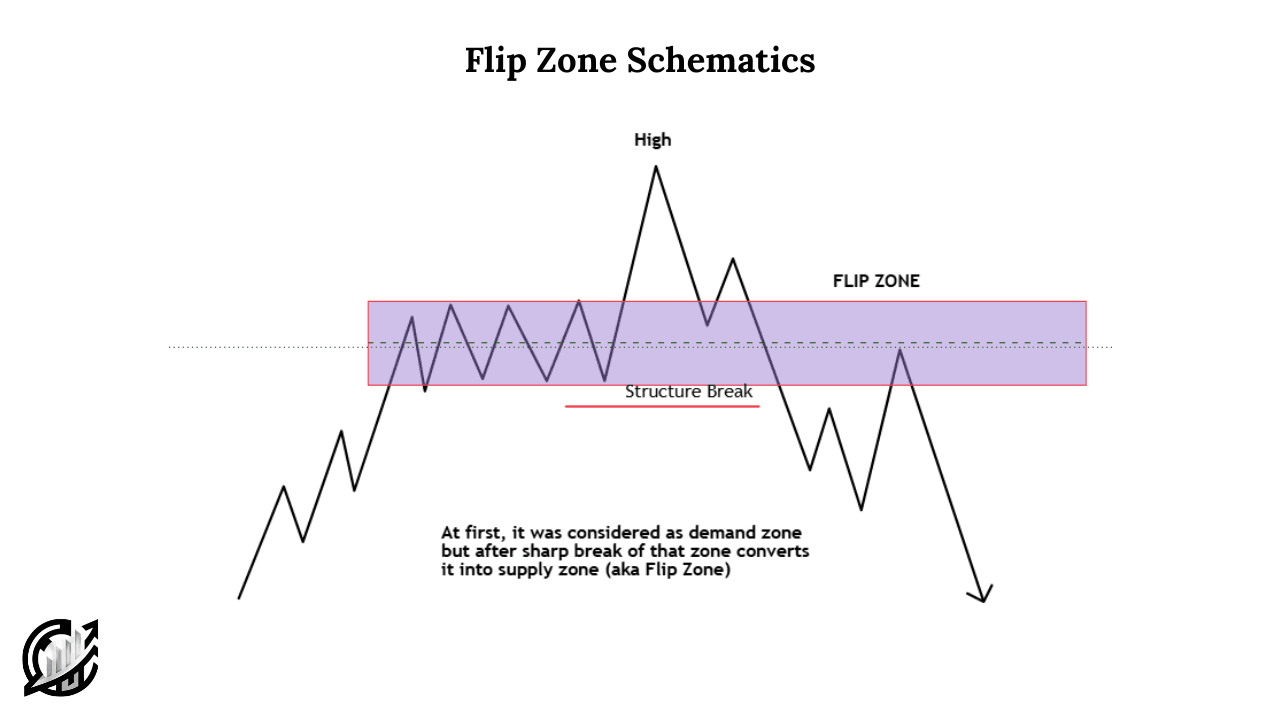
It is a role reversal zone. It forms when a breached supply zone becomes a demand zone or a breached demand zone becomes a supply zone. Flip zones are among the highest-probability SMC setups because the zone has already been tested.
Strongest Pattern Combination: The DBD zone embedded with a Fair Value Gap inside the base, at a higher timeframe discount level, in a bullish trend. It is widely considered the highest-probability S&D trade setup in SMC framework. All three confluence layers stack to produce an exceptionally clean institutional entry point.
Supply and Demand Trading Strategy: Step-by-Step Guide
The following eight-step process is the complete SMC supply and demand trading strategy:
- Establish HTF Bias: On the daily or 4-hour chart, determine the dominant market trend. Confirm whether the market is trending (bullish or bearish) or ranging (consolidation). Only trade the demand zone in bullish structure, and the supply zone in bearish structure. Never frame your trades against the institutional bias.
- Identify the zone origin: Locate the most recent strong impulsive departure from a tight base. The departure defines your zone.
- Check zone freshness: The must be unmitigated. Fresh zones carry the highest probability because the full institutional order stack is still pending. Two or more retests signal zone mitigation.
- Add SMC confluence: Does the zone aligns with a FVG, Order Block, OTE Zone, or BOS. Multiple confluences increase the probability that the zone will produce a strong reaction on the next retest.
- Wait for zone retest: Do not enter the moment you identify the zone. Wait patiently for the price to retrace into it. For a demand zone, price must come back down into the zone from above. For a supply zone, price must rally up into it from below. Zones are not predictive until price actually arrives at them.
- Confirm on lower timeframe: Drop to the 15-minute or 5-minute chart as price enters the zone. Look for a shift in market structure in the direction of the zone’s expected reaction, a Fair Value Gap retest, or a strong rejection candle. Do not enter without confirmation.
- Enter and set stop-loss: Enter on the confirmation signal. For demand zones longs: stop-loss below the zone’s lowest point (10 – 15 points below for forex, 5-10 pips for gold). For supply zone shorts: Stop above the zone’s highest point. Keep risk at 1-2% of account balance per trade regardless of confidence level.
- Set profit target: The nearest draw on liquidity in the direction of the trade.
Zone Invalidation Rule: A supply or demand zone is invalidated the moment price closes through it without reacting. A wick through the zone is acceptable because wick represent liquidity grabs. However, a full candle body closing beyond the zone boundary signals that the institutional orders have been fully absorbed. Remove the zone from your chart and do not trade it further.
Supply and Demand Zones in Forex: AUD/NZD Example
Here is a concrete S&D trading example on AUD/NZD using the 4-hour chart to show how an institutional supply zone setup works from identification to exit.
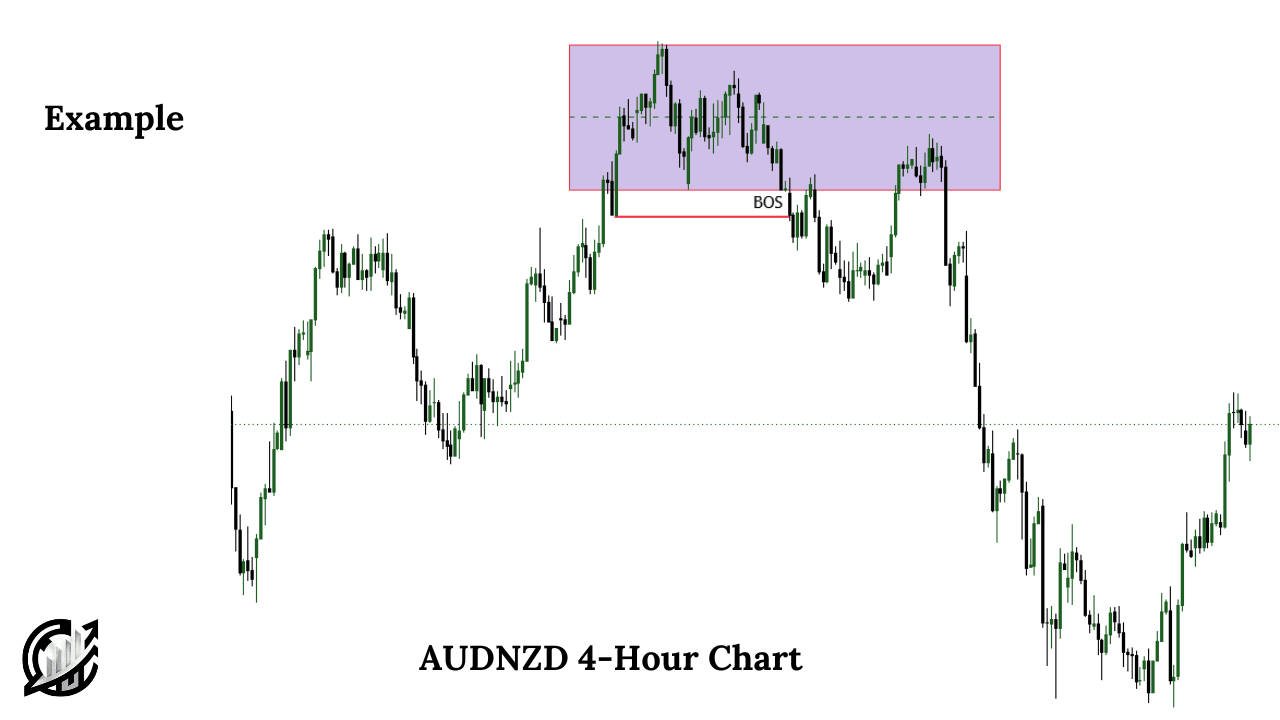
AUD/NZD is in a clear bullish trend on the 4-hour chart. Direction Bias is clearly bullish on 4-hour chart. Market creates consolidation range and moves downward. After creating a sharp downward move, market retest the base of the newly created supply.
On smaller timeframe (15-minute), market shows signs of structure break. The patterns become reversal pattern. From intraday trading perspective, market reaches the nearly draw on liquidity. The logic of intraday trade lies in MSS on 15-minute chart and the nearly available DOL.
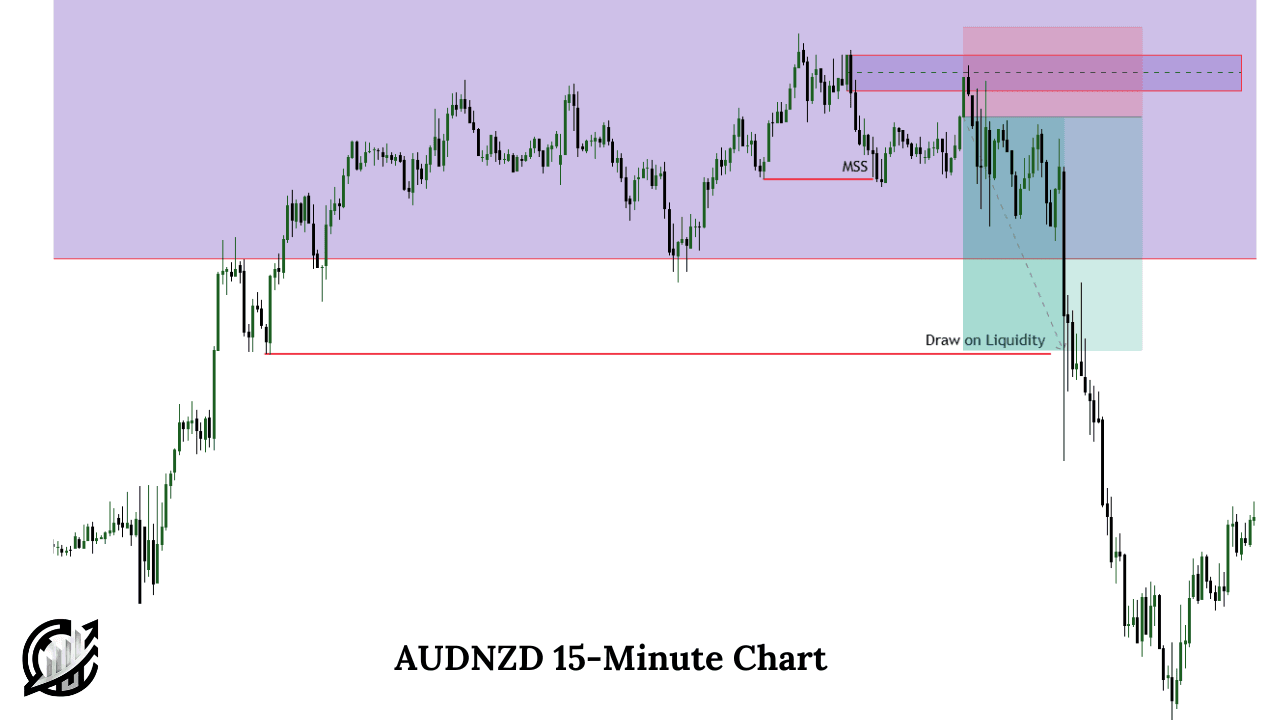
For swing trade, it is recommended to target near swing low available on 1-hour chart. Remember, in any trading strategy, never risk more than 1-2% of your portfolio, and never overtrade if analysis fails.
Final Thought
Supply and demand are the precise price levels where the largest participants in the financial markets placed their orders, and where they are most likely to interested in opening positions when price returns to these areas.
However, other SMC concepts can be used for further clarification and interpretation of the market scenario. Just like we have observed that MSS on lower timeframe and price revisit to lower timeframe confirms the directional shift in market structure. This helps us reconstruct our directional bias.
FAQs
What is the difference between supply and demand zones and support and resistance?
Traditional support and resistance are drawn across multiple touchpoints overtime. SMC supply and demand zones are identified from a single explosive departure event – the institutional origin. S&D zone are not line based. A low and high of the consolidation zone creates a supply and demand zone.
How do you know if a supply and demand zone is still valid?
A zone remains valid as long as it remains fresh. A zone touched two or three times is progressively weaker. A zone is fully invalidated when price closes a full candle body through it without producing any reversal reaction. It is considered that the institutional order at that level have been absorbed.
What makes a supply or demand zone strong vs weak?
You can treat the zone as strong when there is a sharp and impulsive departure with displacement candlesticks with minimal wicks and FVGs. Also, there must be a tight, compact base of 2 to 5 candles in a controlled range before the explosive move. Lastly, for the zone to be strong, the zone should be fresh.
Weak zones are characterized by slow, grinding departure, wide loose bases, multiple retests, and no SMC confluence.

I’m Abdullah Shah, a content writer with three years of experience in crafting engaging and informative content. My background in market analysis complements my work, allowing me to create content that resonates with audiences. I’m also a seasoned practitioner in the forex and crypto markets, with a strong foundation and deep interest in finance. My passion for the financial world drives me to produce content that is both insightful and valuable for those interested in understanding market trends and financial strategies.