If you’ve ever wondered why the market keeps repeating the same general pattern — sideways, then up, then sideways again, then down — you’ve already noticed something that Richard Wyckoff formalized nearly a century ago.
Markets do not move randomly. They move in cycles — predictable, repeating sequences of institutional behavior that produce the same four phases over and over, in all financial assets.
Understanding the Wyckoff market cycle and its four phases gives you something most traders never have: a map. A clear picture of where you are in the market’s journey — and therefore what you should be doing: buying, holding, selling, or shorting.
This guide breaks down each of the four Wyckoff market cycle phases in plain language, with precise identification signals and trading strategies for each.

What Is the Wyckoff Market Cycle?
The Wyckoff market cycle is a four-phase model that describes how markets transition from low prices to high prices and back again — driven by the systematic activity of institutional participants (the “Composite Man”) who accumulate, mark up, distribute, and mark down assets in a recurring sequence.
The cycle exists because large institutions cannot simply buy an asset and immediately sell it for a profit. They need:
- A low price environment to buy without moving the market against themselves
- A rising market to attract retail buyers and elevate their average sale price
- A high price environment to sell without immediately crashing the price
- A falling market to allow prices to return to levels where accumulation can begin again
These four needs produce the four phases — and the cycle repeats indefinitely.
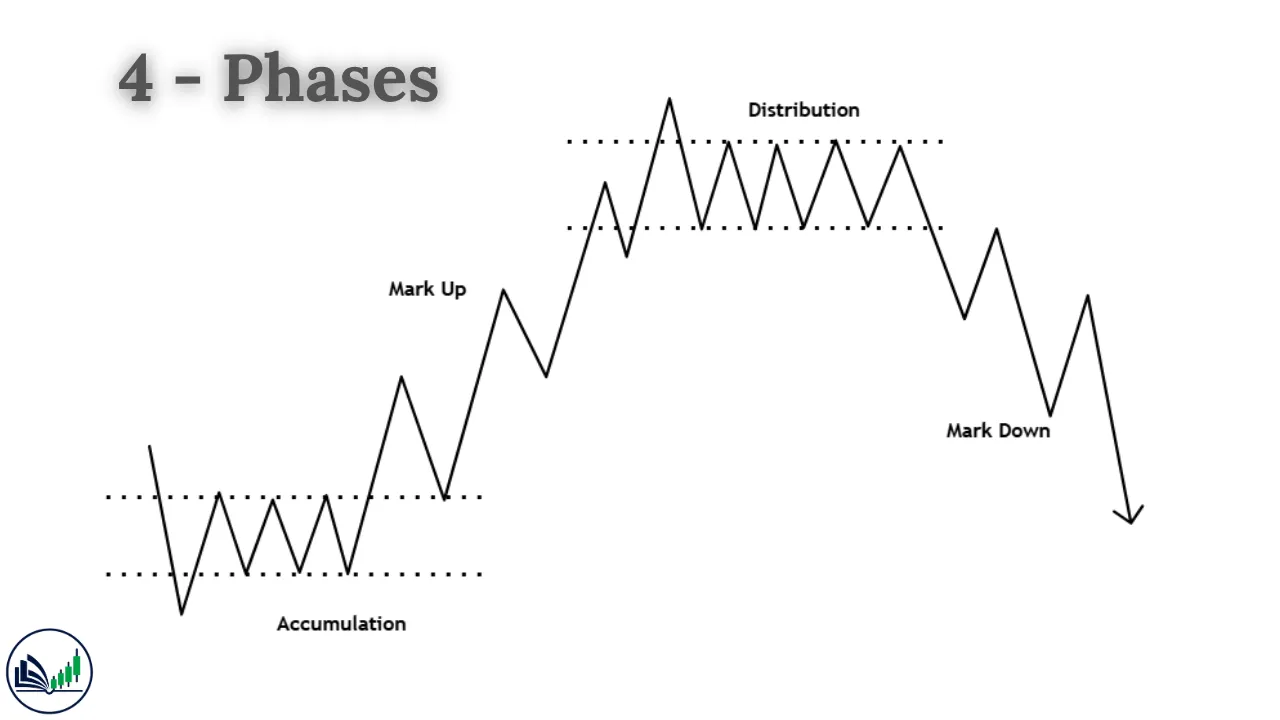
Phase 1: Accumulation — “Smart Money Buys Quietly”
Why Accumulation Happens
The Accumulation phase begins at the end of a prior downtrend. Price action becomes sideways and range-bound. To most retail traders, the market looks “stuck” — going nowhere, with no clear direction.
Behind the scenes, institutional participants are systematically absorbing the supply being sold by panicked retail traders. They are buying gradually, carefully, without causing dramatic price spikes that would alert other participants to their activity.
How to Identify Accumulation
| Signal | What to Look For |
|---|---|
| Price behavior | Sideways range after a meaningful decline; lower volatility |
| Volume on down-moves | Declining — selling pressure is being absorbed |
| Volume on up-moves | Slightly higher — buying interest is present |
| Candle behavior | Long lower wicks at support; rejected attempts to break lower |
| Sentiment | Bearish or neutral; retail traders avoid the asset |
| Key event | Selling Climax (SC) followed by Spring false breakdown |
Trading Strategy in Accumulation
- DO: Watch patiently for the Spring (false breakdown below range) and the Sign of Strength (breakout above range)
- DO: Begin building a position on the Last Point of Support (LPS) after the breakout
- DON’T: Enter during Phase B absorption — the range isn’t finished yet
- DON’T: Short the range — the floor is supported by institutional demand
Phase 2: Markup — “Smart Money Profits as Retail Joins”
What Happens
The Markup phase begins after accumulation is complete. Price breaks above the resistance established during the trading range and begins a sustained uptrend. Volume increases on up-moves and decreases on pullbacks — the classic signature of a healthy trend.
This is the phase where institutional participants allow their positions to appreciate in value as retail traders and momentum traders gradually discover the move and pile in, driving prices higher.
The Markup phase is characterized by:
- Higher highs and higher lows
- Price breaking through previous resistance levels
- Increasing public interest, media coverage, and bullish sentiment
- Occasional “pullbacks to re-accumulation zones” that reset the trend
How to Identify Markup
| Signal | What to Look For |
|---|---|
| Price behavior | Higher highs and higher lows; clear uptrend structure |
| Volume on rallies | Rising — institutional and retail participation increasing |
| Volume on pullbacks | Falling — shallow, low-volume corrections |
| Sentiment | Increasingly bullish; media coverage turns positive |
| Moving averages | Price trading above 50-day and 200-day MAs |
Trading Strategy in Markup
- DO: Buy pullbacks to re-accumulation zones and prior breakout levels (now support)
- DO: Use trailing stops to stay in the trend as long as possible
- DO: Watch volume on rallies — declining volume in an uptrend is an early distribution warning
- DON’T: Short the trend because it “went up too much”
- DON’T: Ignore early signs of distribution forming at the top
Phase 3: Distribution — “Smart Money Exits While Retail Buys”
What Happens
The Distribution phase begins when the Markup has run its course. Price again becomes sideways and range-bound — but this time at the top of the trend, not the bottom.
Retail traders see this sideways movement as healthy consolidation before the next move higher. Institutions see it as an opportunity to exit their positions by selling into the buying demand created by optimistic retail participants.
The Distribution phase is a mirror image of accumulation — but instead of absorbing supply, institutions are creating it.
How to Identify Distribution
| Signal | What to Look For |
|---|---|
| Price behavior | Sideways range after significant uptrend; failed breakouts |
| Volume on up-moves | Declining — institutional demand is shrinking |
| Volume on down-moves | Rising — selling pressure is building |
| Key event | Buying Climax (BC) followed by Upthrust After Distribution (UTAD) |
| Candle behavior | Long upper wicks at resistance; failed attempts to break higher |
| Sentiment | Bullish or euphoric; retail traders are buying the range |
Trading Strategy in Distribution
- DO: Begin reducing long exposure gradually as signs of distribution appear
- DO: Watch for the UTAD (false breakout above range) as a short entry signal
- DO: Use the Last Point of Supply (LPSY) for short entries with tight stops
- DON’T: Add to long positions when price is failing to make new highs on volume
- DON’T: Assume sideways price at a high = accumulation — context is everything
Phase 4: Markdown — “Smart Money Profits From the Decline”
What Happens
The Markdown phase follows the completion of distribution. Price breaks below the support established during the distribution range and enters a sustained downtrend. Volume increases on down-moves and decreases on weak rallies — the inverse of the healthy Markup trend.
Retail traders who bought during distribution are now trapped. Their stop-losses, margin calls, and panic selling add fuel to the decline. The Composite Man is holding short positions, profiting from the forced liquidation of retail participants.
The Markdown phase is characterized by:
- Lower highs and lower lows
- Price breaking through previous support levels
- Increasing bearish media coverage and fear
- Weak rallies that quickly fail (dead-cat bounces)
How to Identify Markdown
| Signal | What to Look For |
|---|---|
| Price behavior | Lower highs and lower lows; clear downtrend structure |
| Volume on declines | Rising — institutional and panic selling |
| Volume on rallies | Falling — weak, low-conviction bounces |
| Sentiment | Bearish; media turns negative; retail sells |
| Key events | Sign of Weakness (SOW) breaks prior support |
Trading Strategy in Markdown
- DO: Short at Last Point of Supply (LPSY) rallies — weak bounces to broken support
- DO: Cover shorts and begin watching for accumulation signs when price shows a Selling Climax
- DON’T: “Buy the dip” during early markdown — the trend is your enemy
- DON’T: Assume the decline is over based on “oversold” indicators alone
How to Identify Which Phase You Are In
Many traders know the four phases but struggle to identify which one they’re currently in. Here is a practical three-step approach:
Step 1: Check the Prior Trend
Accumulation follows a downtrend. Distribution follows an uptrend. Markup and Markdown are the trends themselves.
Step 2: Analyze Volume Behavior
- Volume declining on down-moves → accumulation likely
- Volume expanding on up-moves → markup confirmed
- Volume declining on up-moves → distribution likely
- Volume expanding on down-moves → markdown confirmed
Step 3: Look for Phase-Defining Events
- Selling Climax + Spring → confirming accumulation
- Buying Climax + UTAD → confirming distribution
- Sign of Strength breakout → markup beginning
- Sign of Weakness breakdown → markdown beginning
Conclusion
The Wyckoff market cycle is one of the most powerful frameworks ever developed for understanding markets — because it explains not just what price does, but why: because large institutions need to complete four stages of activity to maximize their returns.
Knowing which phase you’re in doesn’t just tell you what trade to make — it tells you what not to do. Don’t buy in distribution. Don’t short in accumulation. Don’t panic-sell in markdown (you’re selling to the Composite Man who is accumulating again).
The cycle is always running. Your job is simply to identify where you are in it — and let smart money do the heavy lifting.

I’m Aatiq Shah, a dedicated forex and crypto market practitioner with three years of hands-on experience. Currently, I’m working as a Financial Manager. My journey in the world of finance has equipped me with the skills and knowledge needed to navigate the complexities of the forex and crypto markets.