Few candlestick shapes tell as clear a story as the hammer. Picture a market grinding lower, sellers feeling confident, and then suddenly — within a single candle — buyers step in hard enough to erase almost the entire decline. That dramatic recovery, captured in one candle, is exactly what a hammer represents.
“A hammer candle isn’t quiet strength. It’s a visible fightback happening in real time.”
In this guide, we’ll cover what the hammer pattern actually is, why its shape matters so much, how to tell a genuine hammer from a false signal, and how to trade it with a sensible, repeatable process — all explained in plain, beginner-friendly language.

What Is a Hammer Candlestick Pattern?
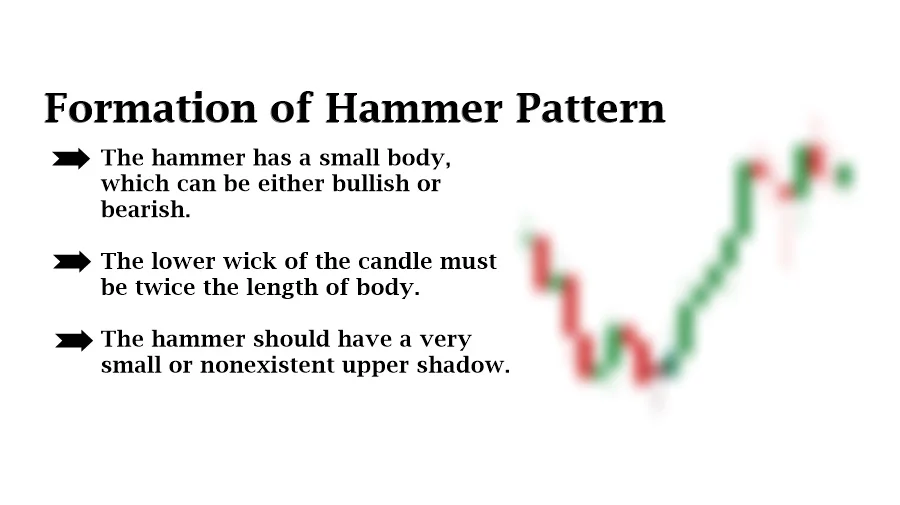
A hammer is a single candlestick with three defining features:
- A small body positioned near the top of the candle’s overall range
- A long lower wick, ideally at least twice the length of the body
- Little to no upper wick
This shape typically appears after a downtrend, and it visually represents a session where sellers pushed price sharply lower, only for buyers to step in and drive it back up near where it opens.
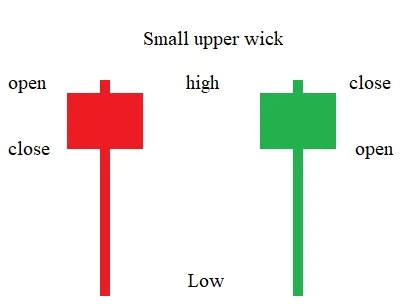
“The long lower wick is the story. It shows exactly how far sellers pushed — and exactly how hard buyers pushed back.”
Why the Shape of a Hammer Matters So Much
Every part of a hammer’s structure carries meaning:
- The long lower wick shows sellers were initially in control, pushing price well below the open.
- The small body near the top shows buyers eventually reclaimed nearly all of that lost ground before the candle closed.
- The lack of an upper wick shows buyers held their gains right through to the close, without giving any of it back.
Together, this combination suggests a meaningful shift in control — sellers tried to extend the downtrend and were firmly rejected.
Where a Hammer Should Form to Be Reliable
Context is everything with this pattern. A hammer is far more meaningful when it appears:
- After a clear, established downtrend (not in a sideways or choppy market)
- At a previously tested support level, trendline, or round number
- Alongside noticeably higher-than-average volume, suggesting real buying interest
A hammer-shaped candle appearing randomly in the middle of a range, with no meaningful trend behind it, carries far less significance — even though it looks identical on the chart.

“The same shape means very different things depending on where it shows up. Location is half the signal.”
Hammer vs Hanging Man: Same Shape, Opposite Meaning
This is one of the most common points of confusion for beginners. A hammer and a hanging man are visually identical — small body near the top, long lower wick, little upper wick. The only difference is the trend it appears in:
- Found after a downtrend, it’s called a hammer and leans bullish.
- Found after an uptrend, the exact same shape is called a hanging man and leans bearish, warning that selling pressure may be creeping in.
This is a perfect example of why candlestick patterns can never be read in isolation from the trend around them.
Hammer vs Inverted Hammer: Don’t Confuse the Two
Another common mix-up. The hammer has its long wick on the bottom, showing rejection of lower prices. The inverted hammer has its long wick on the top instead, with a small body near the bottom — showing buyers tested higher prices during the session, even though the close ended up near the open. Both can appear as bullish signals after a downtrend, but they reflect slightly different price behavior within the candle.
How to Trade a Hammer Candlestick Pattern
- Confirm you’re in a genuine downtrend before treating any candle as a potential hammer signal.
- Check whether the hammer is forming at a meaningful support level, trendline, or round number.
- Compare the volume on the hammer candle to recent bars — a volume spike adds real credibility to the signal.
- Wait for the next candle to close bullish as confirmation, rather than entering the moment the hammer forms.
- Place your stop loss just below the low of the hammer’s wick.
- Target the next visible resistance level or use a fixed risk-reward ratio for your exit.
“The hammer shows you the fightback happened. The next candle shows you whether it’s going to stick.”
Common Mistakes Traders Make With the Hammer
- Ignoring the prevailing trend, treating any hammer-shaped candle as automatically bullish, even in an uptrend (where it’s actually a hanging man).
- Skipping confirmation, buying immediately when the hammer forms instead of waiting for the following candle.
- Forgetting about volume, missing the difference between a genuine reversal attempt and a low-conviction wick.
- Trading hammers in the middle of sideways ranges, where the pattern carries far less predictive value.
- Setting stops too tight, getting knocked out by normal volatility just beyond the hammer’s low before the real move develops.
Can a Hammer Pattern Fail?
Yes — like every candlestick pattern, a hammer is a probability tool, not a guarantee. Price can continue falling right through the hammer’s low, especially in a strong, momentum-driven downtrend or during a major news event. This is exactly why confirmation from the following candle, along with a properly placed stop loss, matters so much. No single candle should ever be traded with blind confidence.
“A hammer improves your odds. It doesn’t remove your risk.”
Final Thoughts
The hammer candlestick pattern captures one of the most visually satisfying moments in price action trading — a market that looked ready to keep falling, only for buyers to step in and firmly reclaim control within a single candle. Its power comes not from the shape alone, but from reading that shape correctly against the trend, the level, and the volume surrounding it.
“Learn to read the fightback, and downtrends stop feeling permanent.”
Start by scanning historical charts for hammer patterns forming at clear support levels after sustained downtrends, and study how price actually behaved in the candles that followed. That hands-on practice is what eventually turns pattern recognition into genuine trading confidence.
Disclaimer: This article is for educational purposes only and does not constitute financial advice. Trading involves risk, and past patterns do not guarantee future results.

I’m Abdullah Shah, a content writer with three years of experience in crafting engaging and informative content. My background in market analysis complements my work, allowing me to create content that resonates with audiences. I’m also a seasoned practitioner in the forex and crypto markets, with a strong foundation and deep interest in finance. My passion for the financial world drives me to produce content that is both insightful and valuable for those interested in understanding market trends and financial strategies.