Table of Contents
In trading, volume spread analysis is used to track the entries and exit of smart money. It is not a pure Smart money approach to trading but rather used to find the footprints of smart money. The VSA method works well at highlighting the imbalances between supply and demand.
This article explores background to VSA, its components, and core concepts of volume spread analysis.
Background to Volume Spread Analysis (VSA)
The foundational knowledge of this system was extracted from the work of Richard Wyckoff. Wyckoff is considered as legendary trader from the early 20th century. Wyckoff studies are aimed at the behavior of large institutions and professional traders. He refined trading methodologies based on volume, price movement, and market structure. VSA is considered as evolution in volume trading. It provides more deep insights than other volume trading theories.
Wyckoff was the first one who laid the foundation for understanding accumulation, distribution, supply and demand dynamics in financial market. His trading methods were aimed at finding the interest of institutions and smart money. He used volume to observe institutional buying and selling in volume which, in comparison with price movement, can be used to predict upcoming price movements.
Wyckoff trading methodology is adopted in modern trading differently by different traders. However, the premise of the system remains the same for modern trading.’
In 1970s, Wyckoff trading concepts were further refined by Tom Williams. He was a former professional trader who expanded and formalized the system. Tom William introduced the term Volume Spread Analysis and emphasized how market makers manipulate price movements to mislead retail traders. Similarly, Anna Coulling’s Volume Price Analysis (VPA) is insightful interpretation of Wyckoff trading concepts
Volume Spread Analysis (VSA) is a structured approach to analyzing volume, price spread (range), and closing price to identify true intentions of smart money. According to Tom William, VSA applies to all timeframes and asset classes. This including trading stocks, forex, commodities, and cryptocurrencies. This system uncovers hidden buying pressure and selling pressure by analyzing price-volume relationships
Components of VSA
VSA is a methodology aimed at evaluating the relationship between volume, price spread, and closing price to determine market strength or weakness. VSA helps uncover hidden activities of institutional traders. Their activities are often designed to manipulate retail traders and institutions, especially to those who have limited access to the hidden data.
Interpretation of Volume
Volume represents the number of shares, contract, or units traded during a given time period. It is a fundamental indicator of market activity that cannot be ignored.
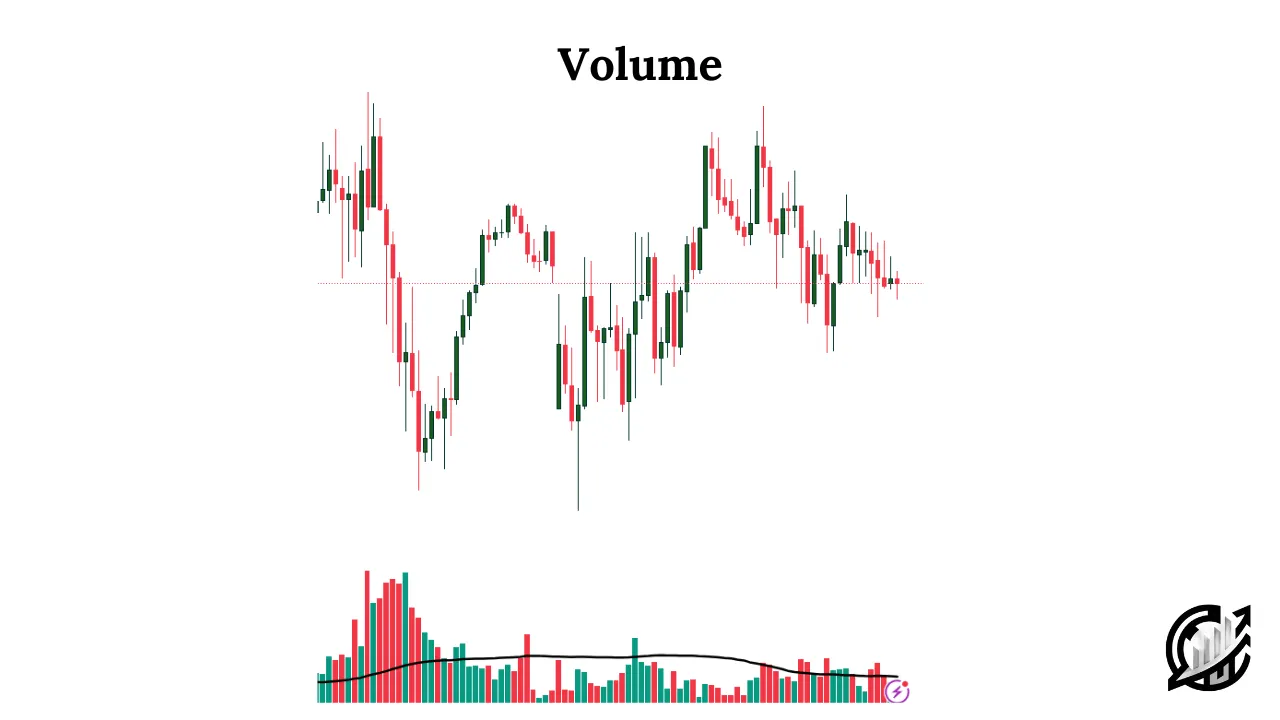
- High volume suggests strong market participation. If price is moving upward on high volume, it typically indicates strong buying pressure. On the other hand, if price is declining on high volume, it signals aggressive selling.
- Low volume suggests weak market participation. This represents lack of strength in a price movement. If price of an asset is rising with low volume, it indicates that demand is fading.
- Lastly, never ignore spikes in volume. Volume spikes have different interpretations. It is referred to as climatic action in a market movement that often results in sideway market or reversal. Most of the time spike in volume stops the market from further movement.
In Volume Spread Analysis, volume is not used along to draw conclusions. It is further combined with price spread and the closing price.
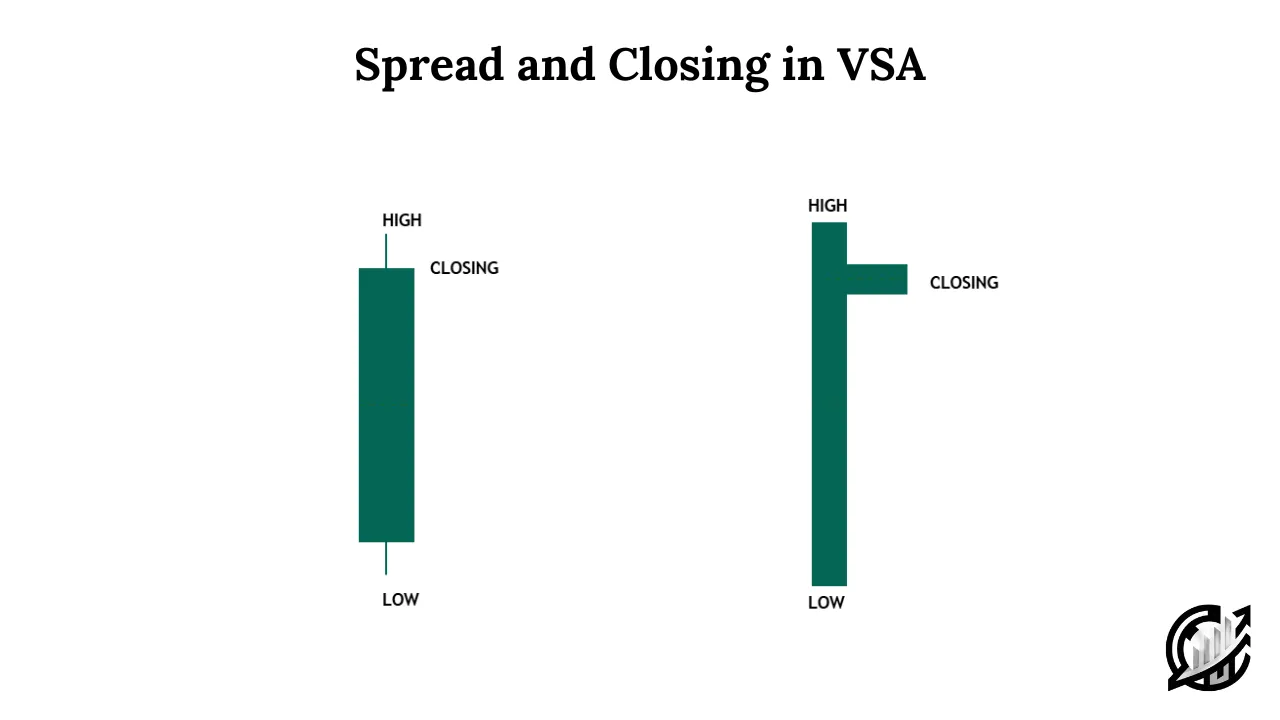
Price Spread (Price Range of a Candle)
The spread refers to the difference between the high and low of a price bar or candlestick. In general, it is the range of price movement within a given period. This can provide us relevant insights into the strength or weakness of a market move.
A wide spread of a candlestick or price bar represents a large difference between the high and low of a candle suggests strong market movement. When wide spread candlestick or price bar is accompanied by high volume, it often indicates strong buying pressure. It reflects harmony. If it is accompanied by low volume, it reflects divergence.
A narrow spread of a candlestick or price bar represents a minimal difference between the high and low of a candle suggest uncertainty or lack of participation. Combining this with volume give us idea of harmony and divergence.
Closing Price
In VSA methodology, the closing price of a candlestick or a price bar is an important element. This is because it shows the strength of buyers and sellers at the end of a trading session. This gives us an idea of whether price action was controlled by bulls or bears.
First condition is the close of price near the high of a candlestick. If this happens, it suggests that buyers were in control and that demand was stronger than supply. If it occurs on high volume, this would be referred to as bullish signal for further price movement.
Second condition is the close of price near the low of a candlestick. If this happens, it signals a strong selling pressure. This suggest that supply is overwhelming demand. This gives an idea that price could further move downside.
Third and last condition is the close of price in the middle of a candlestick. If this happens, this reflects market indecision. This type of action can be noticed with climatic volume. That is the reason it indicates absorption and preparation for a larger move.
Relationship between Volume, Spread, and Closing Price
VSA is a method that can be worthful only if combined accurately with the three components. These three factors work together to reveal whether a price movement is driven by genuine demand and supply or manipulation by smart money.
Wide Spread + High Volume
High volume and wide price spread indicate significant market participation. However, the analysis never ends there. There lies the importance of closing price.
If the candlestick or a price bar closes near the high of its candlestick, it indicates strong buying pressure. It also suggests institutional demand is driving prices higher. A strong bullish candlestick with the high volume and close near the high signal genuine strength. In an uptrend, this suggests continuation of the uptrend.
If the candlestick or a price bar closes near the low of its candlestick, it indicates strong selling pressure. This suggest that smart money may be distributing their positions. A large bearish candle with high volume closing near its low signals aggressive selling pressure. This types of candlesticks in a downtrend suggest downtrend continuation.
Wide Spread + Low Volume
In VSA methodology, a wide price spread with low volume often signals a lack of interest from smart money. Without strong participation either from buyers or sellers, the move is likely to fail or reverse. This reflects anomaly between price and volume.
If price moves up on low volume, it suggest weak demand. In an uptrend, strong candlesticks with low volume often never continue its trend. Most of the time low volume wide spread candlesticks can be seen in false breakouts. This low volume may be manipulated to lure retail traders before a drop.
If a price moves down on low volume, it suggest declining selling pressure. In a downtrend, such candlesticks represent lack of selling momentum and price could reverse or move sideways. This low volume selling is drying up before a bullish reversal.
Narrow Spread + High Volume
A narrow spread with high volume indicates that institutions and smart money are absorbing orders. In major trading sessions like New York trading session and London session, such candlesticks with high volume often signal a transition phase before a major move.
If a price is rising with narrow spreads and highs volume, it indicates that sellers are actively distributing their positions. Buyers are struggling to push the price higher. An asset rising with narrow spread and high volume indicates a distribution before a drop.
If a price is falling down with narrow spreads and high volume, it indicates that buyers are absorbing selling pressure. This also indicates accumulation before a breakout. An asset in a downtrend with narrow spread and high volume indicates a accumulation before a breakout.
For successfully trading with these relationships, traders can identify genuine moves. It also helps in avoiding market traps, and align their trades with institutional entries. With VSA in trading arsenal, you can improve your decision-making skills.
Core Ideology of VSA
The following are the key principles of VSA:
- Strength appears in the down move: When the price is falling but volume remains high with wide spreads, it may indicate that professional traders are absorbing supply. This prepares market for a bullish move.
- Weakness appears in the up move: If price is rising but volume remains high with narrow spreads, it indicates that large institutions are distributing their positions. This prepares the market for sideways movement or reversal.
- Absorption of supply and demand: When price move up on low volume, it signals a lack of demand. Conversely, when price moves down on low volume, it suggest a lack of supply.
- No demand and no supply bars: A small bullish candle with low volume is known as no demand bar. It suggests that buyers are not interested in the up move. Conversely, a small down candle with low volume is known as no supply bar. It indicates weak selling pressure.
Key VSA Patterns for Market Reversal
There are two main patterns that indicate market reversal. Remember, VSA is not a simple concept. It is highly connected with market context. Recent VSA pattern must be verified with respect to market context.
Buying climax and selling climax are two VSA patterns that indicate market reversal but only in there are other VSA patterns in the background. Other VSA patterns like no demand and no supply bar, absorption of supply and demand etc., support buying and selling climax.
A buying climax occurs when a bullish market reaches exhaustion and smart money starts selling aggressively. This is characterized by exceptionally high volume on up-moves, marrow spreads. Price often reaches to new highs but fails to sustain momentum. The market closes near the middle of the bar or candlestick.
A selling climax occurs when a bearish market reaches exhaustion and smart money starts accumulating aggressively. This is characterized by exceptionally high volume on down moves, narrow spreads. Price often reaches to new lows but fails to sustain momentum. The market closes near the middle of the bar or candlestick.
Final Note
Volume spread analysis is a trading strategy based on Wyckoff trading methods. It is used for interpreting market behavior by analyzing volume, price spread, and closing prices. It can be used to craft insights for trading, but cannot be considered foolproof. Remember, if you are using the concepts of VSA, do not use it alone. Try to build confluence in technical analysis. Trading financial markets carries significant risk. It is not suitable for all investors. Past performance is not indicative of future results. It is advised not to trade with the capital that you cannot afford to lose. Along with all that, seek professional advice about your trading strategy.
FAQs
What is Volume Spread Analysis (VSA)?
It is a market analysis technique that studies the relationship between volume, price spread, and closing price. This is used to find and identify the presence and actions of smart money (institutional traders). It is used to find traces of accumulation, distribution, and potential market manipulation.
Who developed VSA?
VSA methodology was originally inspired by the work of Rickard D. Wyckoff. It was later refined and popularized by Tom Williams in the 1970s. He added structure and clarity to the methodology.
What markets and timeframes can VSA be applied to?
VSA can be applied to all liquid markets including stocks, forex, commodities, futures, and cryptocurrencies across all timeframes. As we know that market is fractal, so, whatever applied on higher timeframes can be applied to smaller timeframes with respect to market timeframe structure.
I’m Abdullah Shah, a content writer with three years of experience in crafting engaging and informative content. My background in market analysis complements my work, allowing me to create content that resonates with audiences. I’m also a seasoned practitioner in the forex and crypto markets, with a strong foundation and deep interest in finance. My passion for the financial world drives me to produce content that is both insightful and valuable for those interested in understanding market trends and financial strategies.


