Not every reversal signal in candlestick trading arrives with full conviction. Sometimes the market only tests the waters — buyers push higher, sellers push back, and the candle that results looks unfinished, almost hesitant. That candle is the inverted hammer, and understanding its slightly tentative nature is key to trading it correctly.
“The inverted hammer isn’t a takeover. It’s buyers politely knocking on the door before deciding whether to walk in.”
In this guide, we’ll cover what the inverted hammer pattern actually represents, how it differs from its close lookalike the shooting star, why confirmation matters more here than with almost any other single candle pattern, and how to trade it sensibly — all explained in plain, beginner-friendly language.
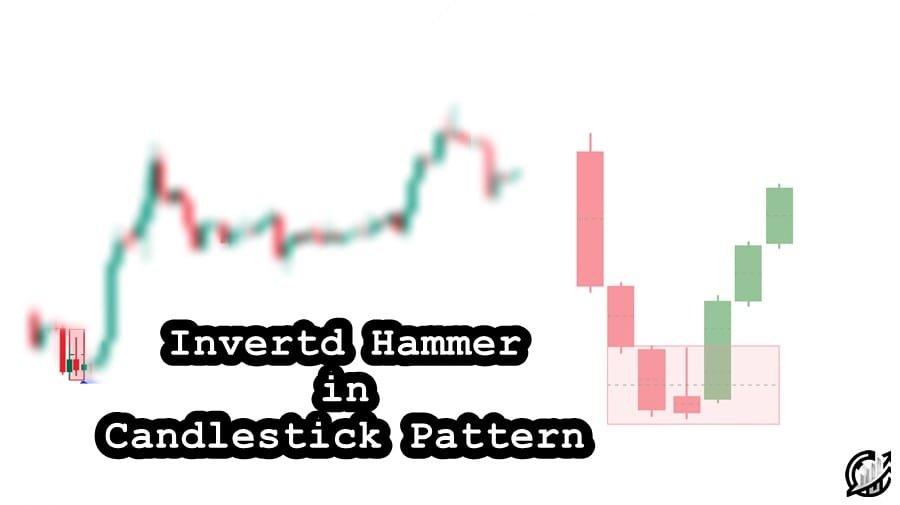
What Is an Inverted Hammer Candlestick Pattern?
An inverted hammer has three defining features:
- A small body positioned near the bottom of the candle’s overall range
- A long upper wick, generally at least twice the length of the body
- Little to no lower wick
This shape typically appears after a downtrend, representing a session where buyers pushed price meaningfully higher during the period, only to see much of that gain fade by the close — though not so much that price fell back below where it opened.
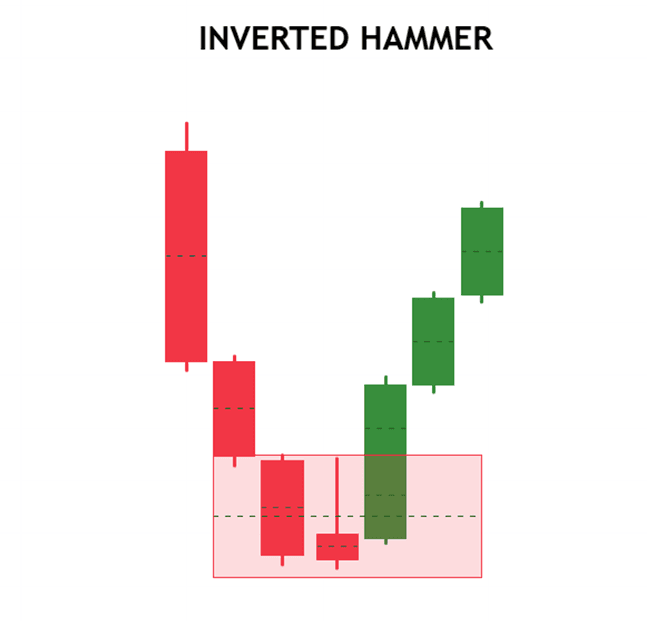
“The long upper wick shows buyers were willing to test higher ground. The small body shows they haven’t fully claimed it yet.”
Why the Inverted Hammer Is Considered Bullish (With a Caveat)
The logic behind this pattern’s bullish interpretation is straightforward: for buyers to push price significantly higher during a downtrend — even temporarily — represents a meaningful shift in sentiment. Sellers, who had been fully in control, suddenly faced real resistance to further declines.
However, this pattern is inherently more tentative than a standard hammer. The fact that price pulled back from its highs before the close shows sellers haven’t been fully overpowered yet — just tested. This is exactly why confirmation from the following candle matters so much more here than with many other single candle signals.
“A hammer shows buyers already winning. An inverted hammer shows buyers just beginning to fight back.”
Inverted Hammer vs Shooting Star: How to Tell Them Apart
These two patterns are visually identical — small body near the bottom, long upper wick, little lower wick — and the only way to distinguish them is by checking the trend they appear in:
| Feature | Inverted Hammer | Shooting Star |
|---|---|---|
| Appears after | A downtrend | An uptrend |
| Typical bias | Bullish reversal (tentative) | Bearish reversal warning |
| Shape | Identical | Identical |
| What it suggests | Buyers testing higher prices | Buyers rejected at highs |
Just like the hammer and hanging man pair, this is another case where the exact same shape carries a completely different meaning depending purely on the trend that precedes it.
Where Should an Inverted Hammer Form to Be Reliable?
Context dramatically affects how much weight this pattern deserves. It’s far more meaningful when it appears:
- After a clear, sustained downtrend rather than a shallow pullback
- At a previously tested support level, trendline, or psychologically significant round number
- Alongside a noticeable increase in volume, suggesting real buying interest rather than a random wick
- Followed by a genuinely bullish confirmation candle
An inverted hammer appearing in the middle of a quiet, sideways range, with no clear trend or nearby support, carries far less significance — even though the shape itself looks identical.
Why Confirmation Matters More With This Pattern
Because the inverted hammer represents only a partial, tentative shift in control rather than a decisive one, it’s considered a weaker signal on its own compared to a standard hammer. Many experienced traders won’t act on an inverted hammer at all until the very next candle confirms the reversal with a strong bullish close, ideally accompanied by good volume.
“Patience isn’t optional here. It’s the entire trade plan.”
How to Trade an Inverted Hammer Candlestick
- Confirm you’re in a genuine, established downtrend before treating the shape as a potential inverted hammer.
- Check whether it’s forming at a meaningful support level, trendline, or round number.
- Compare the candle’s volume to recent bars — a volume increase adds real credibility to the signal.
- Wait for the next candle to close bullish, ideally with a close above the inverted hammer’s body, before considering an entry.
- Place your stop loss just below the low of the inverted hammer.
- Target the next visible resistance level or use a fixed risk-reward ratio for your exit.
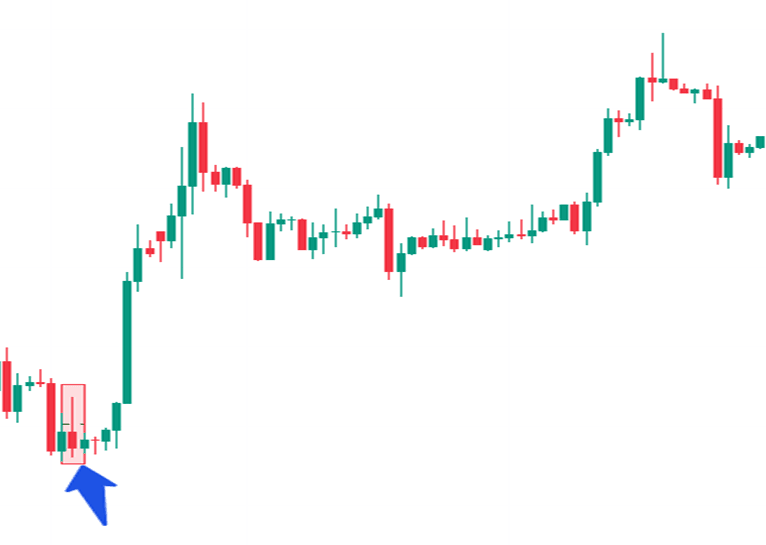
“The inverted hammer asks a question. Confirmation is the only acceptable answer before you commit capital.”
Common Mistakes Traders Make With the Inverted Hammer
- Entering immediately on the pattern without waiting for the next candle’s bullish confirmation.
- Confusing it with a shooting star, especially when scanning charts quickly without checking the surrounding trend.
- Ignoring volume, missing the difference between a genuine test of higher prices and random noise.
- Trading it in sideways or choppy markets, where the downtrend context needed for validity doesn’t actually exist.
- Treating it with the same confidence as a standard hammer, when its more tentative structure actually calls for extra caution.
Can an Inverted Hammer Pattern Fail?
Yes, and given its more tentative nature, it arguably fails more often than a standard hammer when traded without confirmation. A strong, momentum-driven downtrend can easily swallow an inverted hammer whole, with price continuing lower right through its low. This is exactly why treating this pattern as a “watch and wait” signal — rather than an automatic buy trigger — protects traders from some of the most common losses tied to candlestick trading.
“Respect the hesitation built into this candle. It’s not lying to you — it’s genuinely still undecided.”
Final Thoughts
The inverted hammer candlestick pattern captures a moment of cautious optimism rather than outright victory — buyers testing higher ground during a downtrend without yet fully reclaiming it. Understood correctly, and paired with proper confirmation, it can be one of the earlier warning signs that a downtrend is losing its grip, well before more obvious signals appear.
“Learn to read hesitation correctly, and you’ll catch reversals earlier than traders waiting for certainty.”
Start by studying historical charts for this shape forming after clear downtrends near support levels, and pay close attention to whether the following candles actually confirmed the move. That hands-on observation is the fastest way to build genuine trust in this pattern before trading it with real capital.

I’m Abdullah Shah, a content writer with three years of experience in crafting engaging and informative content. My background in market analysis complements my work, allowing me to create content that resonates with audiences. I’m also a seasoned practitioner in the forex and crypto markets, with a strong foundation and deep interest in finance. My passion for the financial world drives me to produce content that is both insightful and valuable for those interested in understanding market trends and financial strategies.