Table of Contents
In price action and market structure trading, having an understanding of strong highs and weak highs is a cornerstone of reading the market sentiment and anticipating future price direction. These concepts reflect how aggressively or weakly price is responding at a swing high.
This article explores an in-depth understanding of strong and weak high in trading, their psychology, and how it affects entries and exits. Lastly, this concept can be used to frame bias for upcoming sessions.
Understanding of Strong and Weak High
A strong high is a point in the market where selling pressure decisively overpowers buying momentum. This is the most simple and straightforward definition for supply and demand traders. After forming this high, price makes a break of structure to the downside. This means that it moves below a previous swing low or support level.
In ICT perspective, after establishing intermediate term or long-term high, market break its structure to downside. This downside breakdown of price takes liquidity below prior lows and confirms that market’s short-term control has shifted until the break of intermediate-term low.
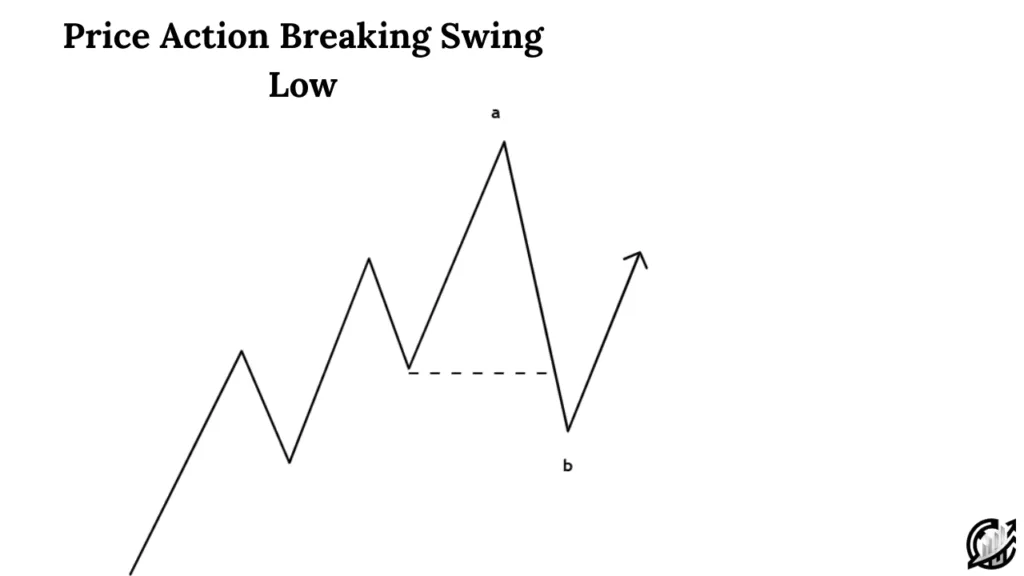
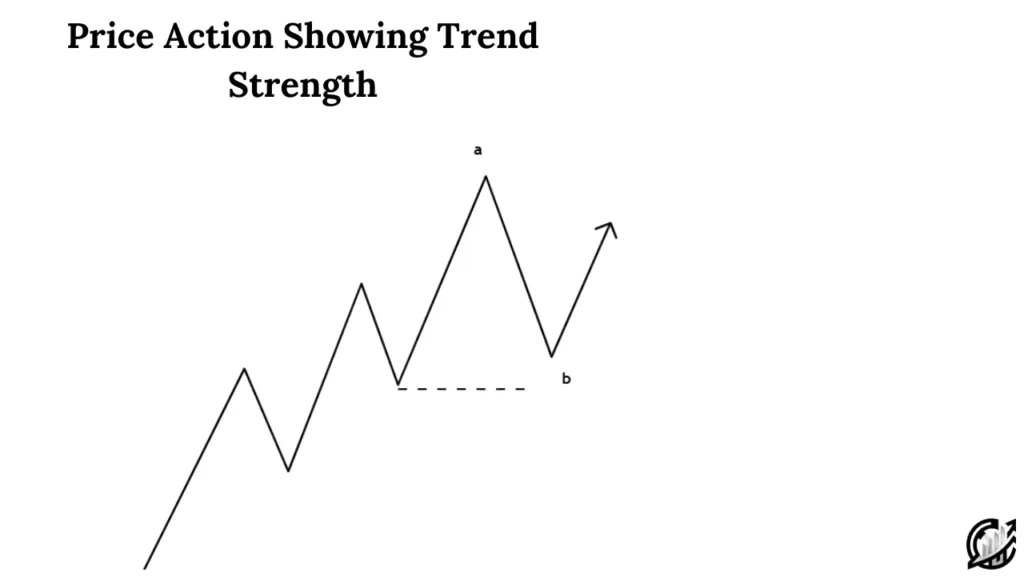
Conversely, a weak high is a swing high that fails to trigger any meaningful downside structure break. Simply, this shows trend continuation. After price peaks, it may pull back slightly. However, it does not break prior swing low or key support zones. In supply and demand terms, this behavior shows that sellers are either exhausted or unable to build momentum.
In SMC terms, price’s inability to perform market structure shift implies that bias is still bullish. The weak high tells traders that the market may be gathering liquidity or preparing for another push upward. In simple terms, we expect the price to break the high instead of recent swing low.
Identification of Strong and Weak High
Identifying a strong highs and weak highs is about turning raw price movement into a reliable reading of market conviction. We can follow the following steps of the process.
Label the Structure
Always start with the bigger picture. This means that plots recent swing highs and swing lows. This gives an understanding of underlying market structure. Uptrend market creates higher highs and higher lows, while downtrend market creates lower lows and lower highs.
Identify Key Structural Levels
In SMC perspective, not every low is equally important. Highlight levels where price previously reversed multiple time. A break of single minor swing low is weaker evidence than a break of multi-touch support zone.
Observe Immediate Reaction After the High
Note price behavior in the candlesticks and bars that follows the high. If price drops and closes below the previous swing low, you have a structural condition for a strong high. If price pullbacks and holds above that previous low and quickly recovers, that is evidence of weak high. It is recommended to use close of candle.
Timeframe Interplay
A high that creates a break of structure on a lower timeframe can be a noise if higher timeframe structure remains bullish.
Watch Retest
After a break, price often retests the broken level. In SMC perspective, price often revisits order block or FVG. If the retest holds as resistance and price fails to reclaims the level, the strong high perception is reinforced.
Practical Rules to Reduce Mistakes
- Always look for a close below structure for a strong high. Never act on wicks. Wicks show the damage.
- Prefer breaks accompanied by volume /momentum confirmation.
- Always check higher timeframe alignment. Avoid a lower timeframe strong high that contradicts the daily trend.
Psychology Behind Strong and Weak Highs
Understanding market psychology is crucial aspect in trading. Understanding logic and psychology behind strong highs and weak highs is crucial for every trader who relies on price action and structure-based trading.
Every single candlestick represents the market behavior and battle between buyers and sellers. Similarly, when we examine highs from this psychological perspective, we begin to see the underlying narrative during key price movement.
A strong high form when sellers start taking control at a key resistance level or swing point. Up to that moment, the market may have been in an uptrend. Each pullback met by new buyers stepping in. When sellers enter the market aggressively, break of structure occurs which represents a shift in collective sentiment. This creates uncertainty. Traders who were previously confident in the bullish trend now face uncertainty.
Psychologically, this scenario marks a change in conviction. Institutions or large players may have distributed their positions. Algorithmic systems that track order flow or structural break might join in, amplifying the move. That is the reason, a strong high is not only a technical event, it is a visible footprint of the market’s shift in belief and positioning.
On the other hand, a weak high paints a very different psychological picture. It occurs when sellers attempt to take control but cannot generate sufficient momentum to break the structure. Market drops but regains strength and defend key support levels. This confirms bullish sentiment and bullish trend continuation.
The psychology behind this is rooted in frustration and imbalance. Weak highs often appear when the market is building liquidity above a key level or when institutional players want to manipulate order flow. Once enough liquidity is gathered below or around key levels, price often resumes its upward direction.
Example of Strong and Weak High
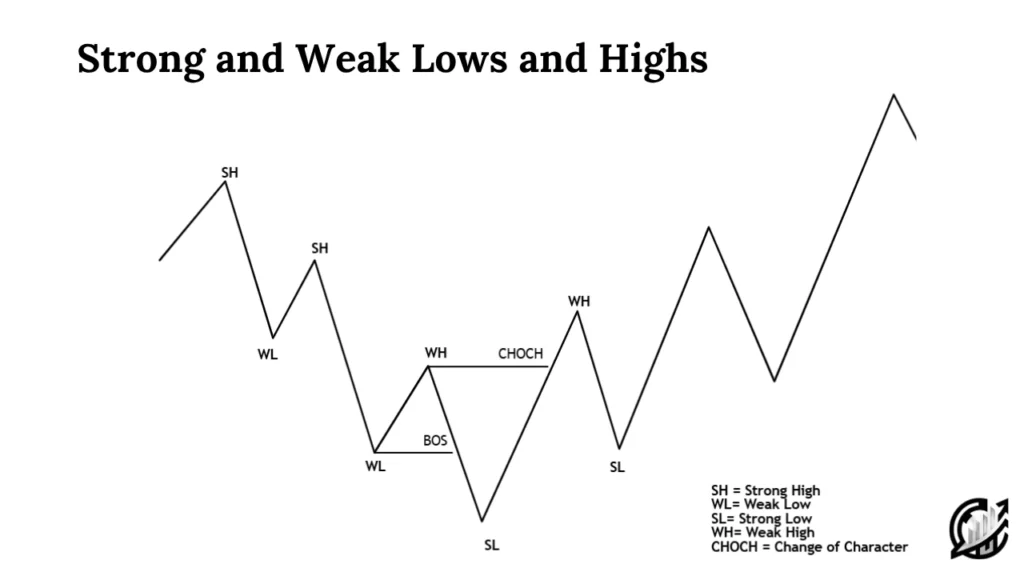
Visualizing how price typically behaves makes it easier to understand strong highs and strong lows.
Strong High (Sequence)
Imagine Price moving in an uptrend and forming a new swing high at point A. At this moment, the market appears strong. It seems that market is strong but selling pressure is building. Sellers begin to step in aggressively. Their activity pushes the price lower.
Soon the price breaks below the previous swing low (Point B). This break of structure confirms that sellers have overwhelmed buyers.
Weak High (Sequence)
Now consider price forming a swing high a point A. Price dips but the pullback never takes the market lower than previous swing low. This inability to close below the prior low shows weak selling momentum. Soon the buyers absorb the pressure and drive the price back upward.
Using Strong and Weak Highs in Practical Trading
Applying the concepts of strong highs and weak highs effectively on SMC trading strategy allows traders to make high-probability trading decisions that align with the underlying market structure.
Understanding the intent behind these highs, traders can refine entry points, manage risk better, and anticipate potential reversals or continuations.
For Selling
A strong high gives short traders a clear opportunity to act with conviction. Once Price forms a high and then breaks below previous support or swing low, seller can trade the retest or ICT PD Arrays. Place your stop loss slightly above the strong high to protect against fakeouts. The reward potential is strong because you are entering in the direction of structure and momentum.
In contrast, weak highs should be approached with caution. Since the market failed to break below previous support, sellers have not confirmed control. Entering short can be risky. The reason is simple that buyer may quickly push the price higher again. It is recommended to wait for break of market structure.
For Long Traders
For buyers, weak highs present valuable opportunities to capitalize on failed bearish attempts. When the price tries to break lower but cannot sustain below previous support, it reveals buyer strength. Traders can plan buying near the defended support area with a stop just below the swing low.
However, after the formation of strong high, long entries become riskier. The market may have shifted into a downtrend, and trying to “catch the bottom” could result in losses.
Final Note
Understanding strong and weak highs helps traders read the market with proper logic and psychology. It also helps them to align with true market structure instead of reacting emotionally. However, there is no strategy that is considered one hundred percent. Sometime market behaves irrationally, and even valid setups may fail.
Financial markets carry risk. Always use proper risk management, including stop-losses and position sizing. This helps in protecting your capital. Always backtest every concept before applying them in live market, and remember that this material is for educational purpose only. Never treat it as financial advice. Trade responsibly and let market structure confirm your bias.
FAQs
What is the main difference between a strong high and a weak high?
A strong high causes a break of structure to the downside, confirming selling dominance. On the other hand, a weak high fails to break previous swing lows, showing bullish dominance.
How to confirm that a strong high is valid?
Always look for a clear structural break, bearish momentum, and possibly increased volume on the move down. A successful retest of the broken support turning into resistance adds further confirmation.
Can a weak high turn into a strong high later?
Yes. If a price later breaks below the previous structural low after initially holding, the weak high can evolve into a strong high as sellers finally gain control.
Which timeframe is best for identifying strong and weak highs?
Higher timeframe such as 4-hour, daily, or weekly provide more reliable signals. However, intraday traders can use smaller timeframes like 15 minutes or 1 hour for shorter-term setups, keeping higher timeframe context in mind.
I’m Abdullah Shah, a content writer with three years of experience in crafting engaging and informative content. My background in market analysis complements my work, allowing me to create content that resonates with audiences. I’m also a seasoned practitioner in the forex and crypto markets, with a strong foundation and deep interest in finance. My passion for the financial world drives me to produce content that is both insightful and valuable for those interested in understanding market trends and financial strategies.