Table of Contents
The Central Bank Dealers Range (CBDR) in ICT refers to the range of price activity during specific timeframes. Price activity during this time is mostly influenced by central bank operations, market making activity, or liquidity provision. In ICT trading CBDR range is analyzed to identify high-probability trade setups by understanding price movements in relation to liquidity, institutional order flow, and market manipulation.
This article explores its understanding, relation with standard deviation, ideal dimension, and its presence in bullish and bearish scenarios.
Understanding of Central Bank Dealers Range (CBDR)
In smart money trading, CBDR refers to a price range that extends between 2:00 PM and 8:00 PM New York local time. This time period captures institutional market activity. CBDR helps traders analyze price behavior within a defined central range and use this range to predict price movement based on standard deviations.
Central Bank Dealers Range is typically visualized as a rectangle encompassing the high and low prices within the defined time window. This range highlights periods of price accumulation where liquidity is pooled by institutions before a potential breakout or trend continuation. The highs and lows of this range is referred to as critical reference points for liquidity sweep and manipulation. Traders should be prepared for potential fake outs or reversals.
Standard Deviations and CBDR
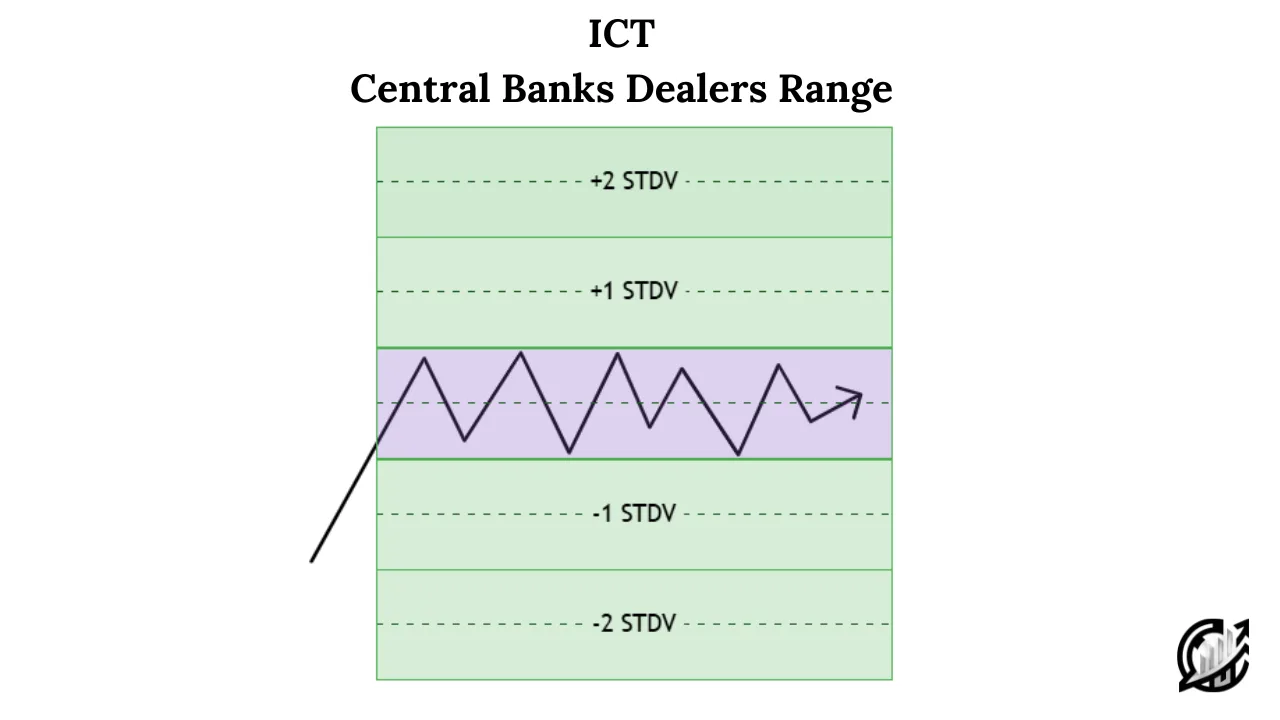
A standard deviation measures the dispersion of price from its mean, or central value, within a dataset. Applying this concept to the CBDR allows traders to anticipate price expansion beyond the central range in both uptrend and downtrend direction. This technique usually creates three zones: central range, one standard deviation above, and one standard deviation below.
Central range is the initial range of price action. This range of price action form between 2:00 PM to 8:00 PM. This forms the base of central range. The same range is applied above the central range, known as one standard deviation above. The same range is applied below the central range, known as one standard deviation below.
This approach to ICT is particularly useful for forecasting price movements after the CBDR forms. If price breaks out from the central range and moves into the standard deviation zones. From there traders closely observe price action. If price break out is weak, there is a possibility that price reverse to the mean.
Ideal CBDR Dimensions
The height of Central Bank Dealers Range (CBDR) is measured by the difference between the high and low within this timeframe. Some traders prefer including wicks in their measurement, ICT methodology prefers using the bodies of the candlesticks for precision. The reason is that bodies of the candlesticks reflect consistent trading activity and institutional intent.
The ideal Central Bank Dealers Range (CBDR) should measure less than 40 pips. A narrower CBDR ensures a more controlled and defined consolidation zone. This allows for clearer identification of liquidity grabs, price manipulations, and potential breakouts. Smaller ranges indicate accumulation of buy and sell orders. This sets the stage for significant price moves.
Conversely, a CBDR larger than 40 pips may suggest excessive volatility or erratic price behavior. Larger CBDR reduces the range’s reliability for trade setups. On such days, it is advised by ICT to step back and let the market establish it direction without forcing trades. Larger ranges may still provide opportunities for scalping. However, this lacks precision and consistency.
Sell Days and CBDR
Michael highlights its importance and can be used to identify institutional price behaviors. Central Bank Dealers Range can be used to predict potential high and low points of the day. It forms between 2:00 PM and 8:00PM New York time. It acts as a central reference point for projecting price movement through standard deviations above and below the range.
On sell days, the high of the day typically forms above the CBDR. In many cases, the high of the day is commonly formed one standard deviation above the CBDR. In ideal situations, the high of the day will not exceed two standard deviations above the range. Sometime sell days may push up to three standard deviations above the CBDR before reversing lower.
After the formation of the high of the day, the price will generally follow a bearish trajectory. Price moves downward to target liquidity below the CBDR. The low of the day can be projected by extending CBDR and its standard deviations downward, marking -3 standard deviations as a potential target.
Remember, never forget the importance of timing while trading with the CBDR. In ICT context, kill zones are important time zones. The low of the day on sell days often forms during the London Kill zone (10:00 AM – 12:00 PM New York Time). This is the time zone where the volume is high and institutions are contributing in the price movement. It is a prime window to identify reversal points.
Buy Days and CBDR
On Buy days, the low of the day typically forms below the CBDR. In many cases, the low of the day is commonly formed one standard deviation below the CBDR. In ideal situations, the low of the day will not exceed two standard deviations below the range. Sometime buy days may push down to three standard deviations below the CBDR before reversing lower.
After the formation of the low of the day, the price generally follows a bullish trajectory. Price moves upward to target liquidity above the CBDR. The high of the day can be projected by extending CBDR and its standard deviations upward, marking +3 standard deviations as a potential target.
Remember, never forget the importance of timing while trading with the CBDR. In trading sessions, kill zones are important time zones. The high of the day on buy days often forms during the London Kill zone (10:00 AM – 12:00 PM New York Time). This is the time zone where the trading volume is high and institutions are contributing in the price movement. It is a prime window to identify reversal points.
Best Timeframe for CBDR Analysis
Timeframe selection in ICT trading is an important factor that cannot be neglected. In Central Bank Dealers Range analysis, the ideal timeframes are lower timeframes. Timeframes from 15-min and lower can be used for ICT CBDR analysis.
These timeframes allow traders to observe price action in greater detail. Using the timeframes we can capture the signs of liquidity grabs, stop hunts and other manipulative behavior of market. Lastly, using lower timeframes make it easy to plot standard deviation for projecting potential price targets.
Best Pairs for CBDR Strategy
Michael put an extra emphasis on trading forex and indices. This strategy was first developed and tested on NASDAQ and E-mini (S&P 500). These markets are highly liquid and effective for this strategy because of predictable institutional behavior.
This strategy is applied to forex and metals as well. Major currency pairs like EUR/USD, GBP/USD, and USD/JPY have shown consistent results with ICT CBDR. Price action of precious metals like Gold and silver also aligns with CBDR approach.
Final Note
The ICT Central Banks Dealers Range (CBDR) offers a structured and highly effective way to anticipate intraday highs and lows. Between 2:00 PM to 8:00 PM, traders often look for institutional price behavior. By integrating standard deviation and aligning with ICT trading sessions and kill zones, CBDR strategy enables to identify potential turning points.
Trading financial instruments carries huge risk and not suitable for all investors. Always conduct your own research before trading or investing. Past price action of any trading instrument does not guarantee future results. This content is for educational purposes only.
FAQs
What is Central Bank Dealers Range (CBDR)?
It is a price range formed between 2:00 PM and 8:00 PM New York local time. This time zone often contains liquidity sweeps or reversals. CBDR strategy is used by ICT traders to identify potential intraday highs and lows based on how price behaves relative to this range.
How to calculate CBDR?
This range is calculated using the high and low between 2:00 PM and 8:00 PM NY time. Smart money and institutional traders prefer using the bodies of candlesticks instead of wicks to determine the height of the range.
What are standard deviations in the context of CBDR?
Standard Deviations represents equal extension of the CDR’s height projected above and below the central range. They help traders predict likely zones for intraday highs and lows.
What are the best timeframes for plotting the CBDR?
The 15-min and lower timeframe are considered as best for accurately marking the CBDR and observing price behavior around standard deviation levels.

I’m Aatiq Shah, a dedicated forex and crypto market practitioner with three years of hands-on experience. Currently, I’m working as a Financial Manager. My journey in the world of finance has equipped me with the skills and knowledge needed to navigate the complexities of the forex and crypto markets.