Long before computer screens and candlestick charts, traders stood beside a small machine that spat out a thin strip of paper. Printed on it were the names of stocks, the prices they traded at, and how many shares changed hands. That strip was called the ticker tape, and the people who studied it were tape readers.
The paper is gone, but the idea is very much alive. Today, it lives in a window on your trading platform called Time & Sales. Learning to read it can show you what other traders are actually doing, not just what they say they’ll do.
Let’s explore what Time & Sales is, how tape reading works, and how a beginner can start using it.
What Is Time & Sales?
Time & Sales is a live, scrolling list of every trade that has been completed in a market. Each line is called a print.
A typical print shows:
| Column | What it means |
|---|---|
| Time | The exact moment the trade happened |
| Price | The price the trade was executed at |
| Size | How many shares, contracts, or coins traded |
| Side (sometimes shown with colour) | Whether the trade hit the bid or lifted the ask |
Think of Time & Sales as the market’s receipt book. Every time a buyer and seller agree, a receipt is printed. Nothing on the tape is a promise or a plan; it’s a done deal.
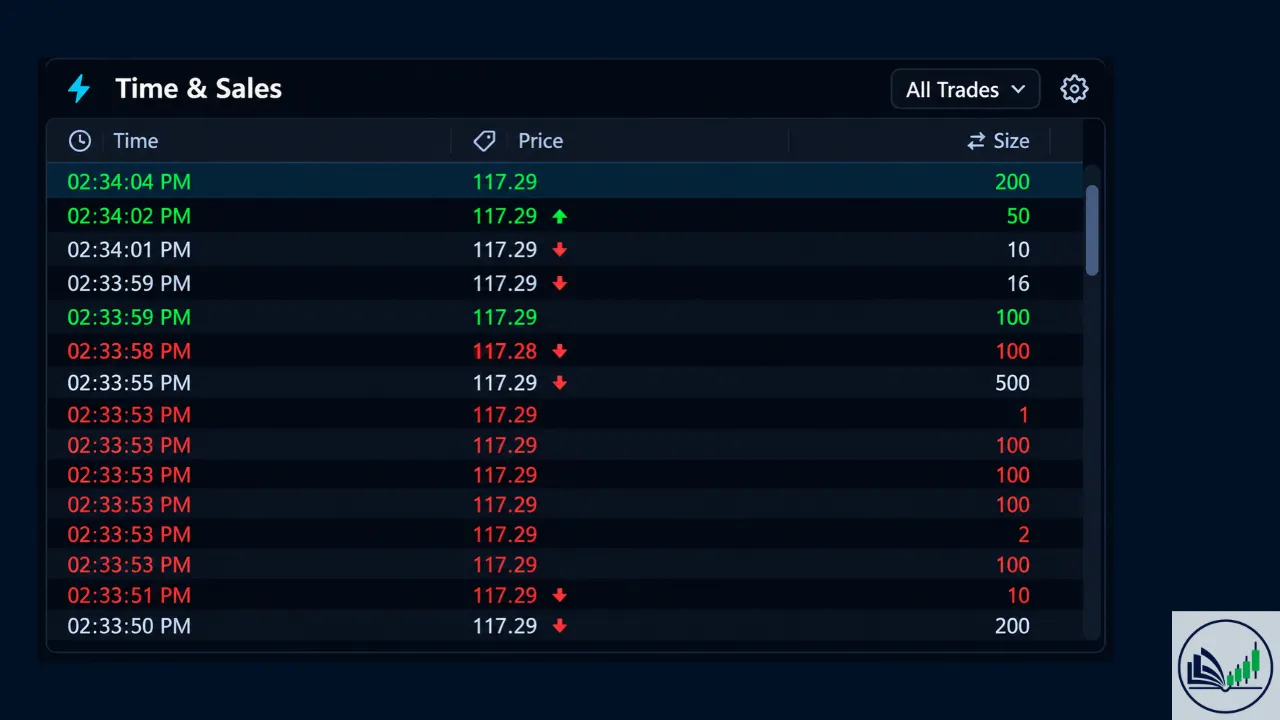
💡 Tip: The order book (Level 2) shows what traders intend to do. Time & Sales shows what they did. When the two disagree, trust the tape.
A Quick History: From Paper to Pixels
The stock ticker was invented in the 1860s. It let brokers follow prices without standing on the exchange floor. Some of the most famous traders in history built their careers on reading it.
Jesse Livermore, whose story is told in Edwin Lefèvre’s 1923 classic Reminiscences of a Stock Operator, started as a teenager chalking prices onto a board from the tape. Richard Wyckoff wrote an entire early book on the subject, Studies in Tape Reading (1910), under the pen name “Rollo Tape.”
Their core insight still holds: price movements leave clues in how trades happen, not just where price ends up.
💬 Quote: “The tape doesn’t lie.” — Long-standing saying among floor traders
How to Read the Tape: The Basics
Colour Coding
Most platforms colour each print to show which side was aggressive. A common scheme is:
| Colour | Usual meaning |
|---|---|
| Green | Trade at the ask: a buyer was aggressive |
| Red | Trade at the bid: a seller was aggressive |
| White / grey | Trade between the bid and ask |
| Bright green / yellow | Trade above the ask (very urgent buying) |
| Magenta / bright red | Trade below the bid (very urgent selling) |
Colors vary between platforms, so always check your software’s settings.
Who Was the Aggressor?
Every trade has two sides, but only one side was in a hurry. A print at the ask usually means someone bought with a market order, so the buyer was aggressive. A print at the bid usually means a seller was aggressive.
By watching which color dominates, you get a feel for which side is pushing.
A simple example:
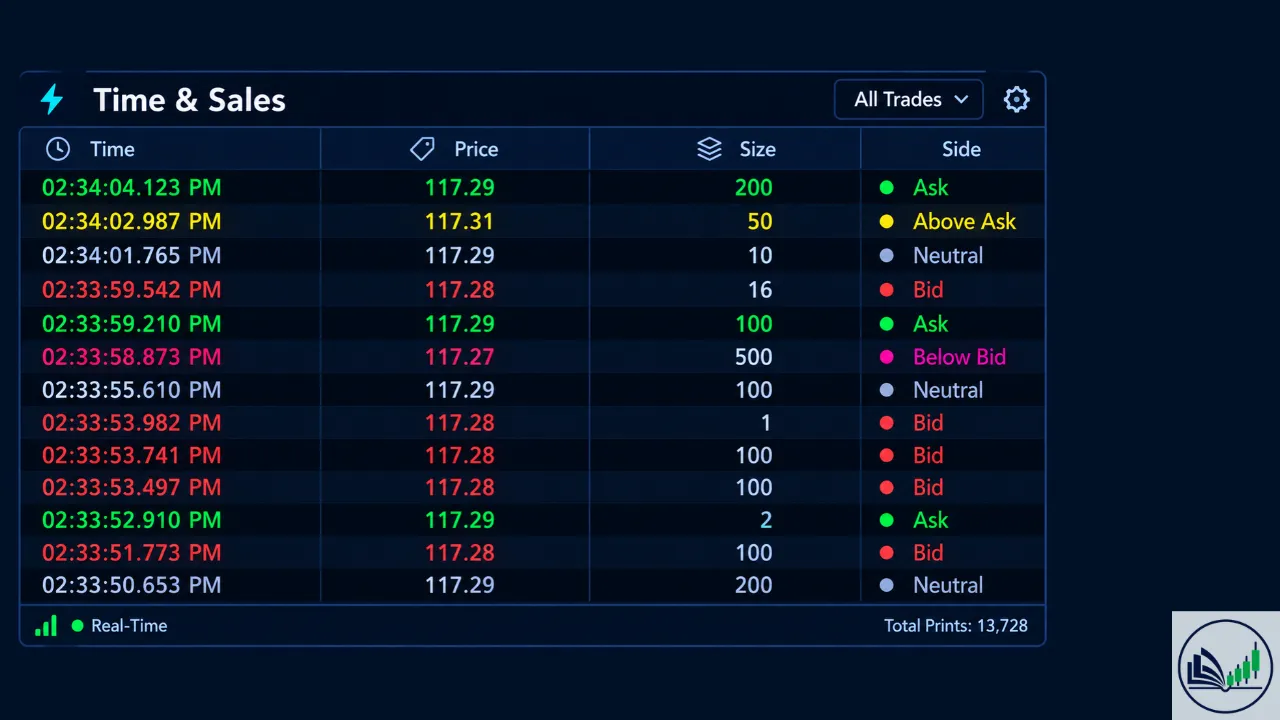
What’s happening? Prints are hitting the ask, sizes are growing, and one trade even paid above the ask. That’s a buyer (or several) who really wants in. Buying pressure is building.
Five Things Tape Readers Watch
1. Size: Who’s in the Room?
Small prints usually come from everyday traders. Large prints, often called block trades, suggest bigger players such as funds or institutions. A sudden burst of unusually large trades can be the first sign of serious interest.
💡 Tip: Use your platform’s size filter to hide tiny trades. Showing only prints above a chosen size makes the important activity stand out instead of getting lost in the noise.
2. Speed: How Fast Is the Tape Moving?
The pace of the tape matters as much as the prices. When prints suddenly flood in faster, attention and urgency are rising. When the tape slows to a trickle, interest is fading. Breakouts that happen on a fast tape tend to be more convincing than ones on a sleepy tape.
3. Direction: Which Side Is Pushing?
Count the colours. A wall of green at rising prices shows buyers in control. A wall of red at falling prices shows sellers in control. Mixed colours at a steady price usually mean a balanced, undecided market.
4. Repetition: The Same Price Again and Again
If you see trade after trade printing at the same price while that price refuses to break, a large hidden order may be sitting there. This is often an iceberg order, one big order revealed only in small slices.
5. Reaction: What Happens After the Big Prints?
This is where real skill lies. Big aggressive buying that pushes price higher shows strength. But big aggressive buying that fails to move price shows that someone on the other side is soaking it all up. That’s called absorption, and it often comes before a reversal.
💬 Quote: “It’s not what happens, it’s how the market reacts to what happens.” — A well-worn trading desk saying
Time & Sales vs Level 2: Better Together
| Feature | Level 2 / DOM | Time & Sales |
|---|---|---|
| Shows | Waiting (pending) orders | Completed trades |
| Can be faked? | Yes; orders can be cancelled | No; trades are final |
| Tells you | Where liquidity sits | Who is acting and how hard |
| Best use | Spotting levels and walls | Confirming real pressure |
Here’s how they work as a team. Suppose Level 2 shows a big sell order at a certain price. If the tape then shows heavy buying pouring into that price and the order keeps refilling, a large seller is defending it. If the order suddenly disappears without any trades on the tape, it was probably never real.
Tape Reading in Different Markets
Stocks
Stock tapes include trades from many exchanges and off-exchange venues. You may see special prints, such as delayed or odd-lot trades, marked with condition codes. Some large off-exchange prints arrive with a delay, so read them with care.
Futures
Futures trade on one central exchange, which makes their tape clean and complete. That’s why many serious tape readers prefer futures contracts.
Crypto
On crypto exchanges, Time & Sales usually appears as trade history or recent trades. Each exchange shows only its own trades, so the picture is partial unless you watch several exchanges.
Forex
Spot forex has no central tape. Your broker’s trade feed reflects only its own flow. Currency futures can serve as a more complete alternative.
Is Tape Reading Still Useful Today?
It’s a fair question. Modern markets are dominated by fast computer programs, and big orders are often sliced into hundreds of tiny trades to hide them.
That makes tape reading harder than it was in Livermore’s day, but not useless. Here’s why:
- Large players still leave footprints. Even split orders create patterns in pace, repetition, and direction.
- Completed trades can’t be faked the way resting orders can.
- It sharpens timing. Many traders use the tape only in the final seconds before entering a planned trade.
The key change is in how traders use it. Rather than staring at every print all day, most modern tape readers watch it only at important price levels.
💡 Tip: Don’t watch the tape everywhere. Mark your key support and resistance levels on the chart first, then switch your focus to Time & Sales only when price approaches those zones.
Common Tape Reading Mistakes
- Reading every print. Thousands of tiny trades will overwhelm you. Filter by size.
- Ignoring context. A big buy print means far more at a key support level than in the middle of a range.
- Assuming one big print sets the direction. One large trade could be someone closing a position, not opening one.
- Forgetting about news. During major announcements, the tape gets chaotic and less reliable.
- Chasing the colours. Seeing a burst of green and jumping in blindly is a fast way to buy the top.
How to Start Practising Tape Reading
- Choose one liquid market. A popular futures contract or a heavily traded stock is ideal.
- Set up a size filter. Hide the smallest trades so key prints stand out.
- Open Time & Sales next to your chart. Notice how bursts on the tape line up with candles forming.
- Use replay mode. Many platforms let you replay old sessions at slow speed, perfect for learning.
- Focus on one pattern at a time. For a week, look only for absorption. The next week, watch tape speed.
- Journal your observations. Note what the tape showed before strong moves and before failed ones.
- Paper trade first. Only risk real money once your observations are consistent.
💬 Quote: “Patience is bitter, but its fruit is sweet.” — Old proverb, and fitting for anyone learning to read the tape
Final Thoughts
Time & Sales is the market’s honest record. Every line is a real trade, with a real price, a real size, and a real buyer and seller. Tape reading is the skill of listening to that record and noticing when the rhythm changes: when big prints arrive, when the pace speeds up, or when heavy buying suddenly stops moving price.
Paper tapes have vanished, but the lesson from the old masters remains. Price tells you where the market went. The tape tells you how it got there. Learn to read both, keep your risk tight, and give yourself time. The tape rewards patience more than speed.

I’m Abdullah Shah, a content writer with three years of experience in crafting engaging and informative content. My background in market analysis complements my work, allowing me to create content that resonates with audiences. I’m also a seasoned practitioner in the forex and crypto markets, with a strong foundation and deep interest in finance. My passion for the financial world drives me to produce content that is both insightful and valuable for those interested in understanding market trends and financial strategies.