Trends rarely travel in a straight line. A stock can climb for months, then go quiet and drift sideways for weeks. Crypto can plunge, flatten out, and then plunge again. Those sideways pauses create the hardest question in trading: Is the trend just resting, or is it ending?
Richard Wyckoff’s framework answers this with two concepts: reaccumulation (a pause within an uptrend) and redistribution (a pause within a downtrend). Both are continuation ranges — sideways zones that lead to a resumption of the prior trend rather than a reversal.
Mistaking one for its reversal cousin is one of the most expensive errors a trader can make. This guide shows you how to tell them apart.
What Is a Continuation Range?
A continuation range is a trading range that forms in the middle of a trend and ends with price breaking out in the same direction as the trend that came before it.
Wyckoff recognised that large operators rarely complete their campaigns in one go. They may:
- Pause an advance to absorb profit-taking and add more shares (reaccumulation).
- Pause a decline to unload more inventory into bargain hunters (redistribution).
Think of a long staircase. The steps are the trends; the landings are the continuation ranges. You rest on a landing, but you keep climbing (or descending) afterwards.
What is Wyckoff Reaccumulation?
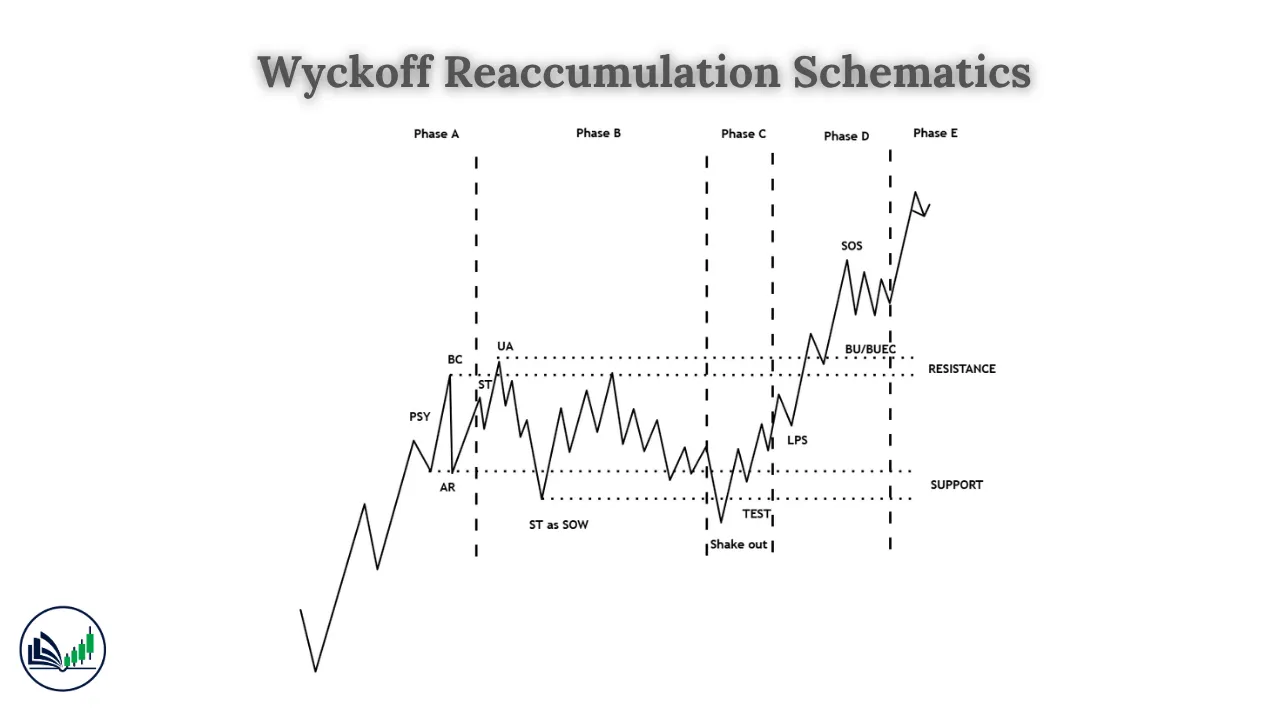
Reaccumulation is a consolidation range that forms during an uptrend, where strong hands absorb shares from early buyers taking profits and from nervous holders, before the next markup leg.
After a big rally, early buyers sell to lock in gains. That selling creates supply. Rather than letting price collapse, larger players absorb it — often while shaking out weak holders — and build a fresh “cause” for the next advance.
The following are the typical features:
| Feature | What to Look For |
|---|---|
| Location | Forms after a clear markup, above prior accumulation |
| Starting event | Often a mild climax or simple stopping action rather than a dramatic buying climax |
| Dips | Each drop toward support usually comes on less volume than the one before |
| Swings | Start wide, then narrow as supply dries up |
| Phase C | Often a spring or shakeout below support that quickly recovers |
| Relative strength | Holds up better than the broad market on sell-offs |
| Exit | Sign of Strength rally through the top, then an LPS pullback |
Reaccumulation ranges are famous for sudden, alarming drops. Because price already rose so much, holders are sitting on profits and are quick to sell when fear hits. A sharp shakeout takes advantage of that, flushing out loose hands before the trend resumes.
Wyckoff Redistribution: The Pause That Reloads a Downtrend
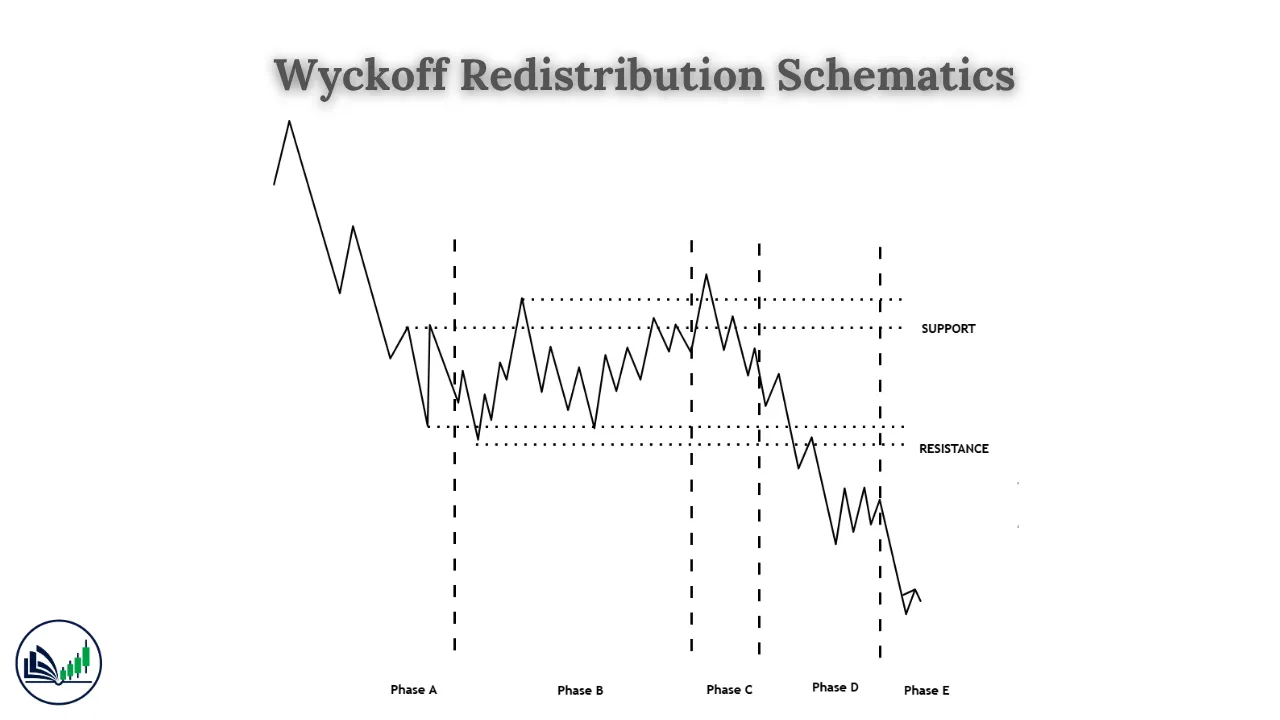
Redistribution is a sideways range that forms during a downtrend, where large sellers unload remaining inventory into bargain hunters and short-covering, before the next markdown leg.
After a steep decline, value buyers step in and shorts take profits. That creates temporary demand. Large holders who still want to sell use this demand to distribute more, then let price fall again.
The following are the typical features of Wyckoff redistribution:
| Feature | What to Look For |
|---|---|
| Location | Forms after a clear markdown, below prior distribution |
| Rallies | Weak, often on shrinking volume, failing to reach earlier highs convincingly |
| Declines | Heavier volume and wider bars on drops |
| Phase C | Often an upthrust above resistance that fails |
| Relative strength | Lags the broad market on rallies |
| Exit | Sign of Weakness breaking the floor, then an LPSY bounce |
The Critical Question: Reaccumulation or Distribution?
A range that forms after an uptrend could be either. On the surface they look the same — sideways price at elevated levels. The Wyckoff Analytics team highlights several clues that separate them.
| Clue | Reaccumulation (Bullish) | Distribution (Bearish) |
|---|---|---|
| Volume on dips | Declining with each test of support | Stays heavy or grows |
| Swing behaviour | Swings narrow, bars quiet down | Volatility and volume intensify |
| Phase C event | Spring / shakeout below support | Upthrust / UTAD above resistance |
| After Phase C | Sign of Strength on wide bars and rising volume | Sign of Weakness on heavy downside volume |
| Relative strength | Beats the index on up days, resists on down days | Lags the index |
| Rallies to the top | Rallies approach or exceed resistance with ease | Rallies stall below resistance |
The same logic, reversed, separates redistribution from Wyckoff accumulation after a downtrend:
| Clue | Redistribution (Bearish) | Accumulation (Bullish) |
|---|---|---|
| Volume on rallies | Declining | Increasing |
| Volume on drops | Heavy | Drying up |
| Phase C event | Upthrust | Spring |
| After Phase C | Sign of Weakness | Sign of Strength |
| Relative strength | Weaker than the market | Stronger than the market |
💡 Remember: You often cannot know for certain until Phase C or D. The Phase C trap and the Phase D follow-through are the tie-breakers.
How to Trade a Reaccumulation Range
The following are the steps that are considered important while trading a reaccumulation range:
- Confirm the uptrend: This include the higher highs and higher lows before the range.
- Define the range: Mark support and resistance of the sideways zone.
- Track volume on dips: Shrinking volume = supply drying up.
- Watch for a spring or shakeout: Buy the reclaim or a low-volume test, stop below the low.
- Or wait for the SOS: A wide-bar, high-volume break through resistance.
- Buy the LPS / back-up: Low-volume pullback to old resistance.
- Target: Project the range width upward from the breakout
How to Trade a Redistribution Range
The following are the steps that are considered important while trading a redistribution range:
- Confirm the downtrend: Lower highs and lower lows before the range.
- Define the range: Mark the floor and ceiling.
- Track volume on rallies: Shrinking volume on bounces = weak demand.
- Watch for an upthrust: Short the failure back inside, stop above the high.
- Or wait for the SOW: Heavy break below support.
- Short the LPSY: Feeble rally to broken support.
- Target: Project the range width downward
Common Mistakes
- Selling every pause. Assuming any range after a rally is a top causes traders to exit strong trends too early — the error Wyckoff Analytics calls one of the most common.
- Buying every dip in a downtrend. A flat range after a crash is often redistribution, not a bottom.
- Judging too early. Phase A and B can look identical in both scenarios. Let Phase C and D speak.
- Ignoring relative strength. Comparing the asset to its index is one of the quickest ways to break a tie.
- Forgetting the bigger picture. A reaccumulation on the daily chart inside a weekly distribution is fragile.
Conclusion
Reaccumulation and redistribution are the market catching its breath. Recognizing them keeps you in winning trends longer and stops you from buying falling knives. The shape alone will not tell you the answer — volume, the Phase C trap and the Phase D follow-through will.
Watch whether dips or rallies are losing energy. Compare the asset with the broader market. Wait for the spring or upthrust, then the confirmation. Read continuation ranges this way and every trend’s “landing” becomes a fresh chance to rejoin the move rather than a reason to guess.

I’m Abdullah Shah, a content writer with three years of experience in crafting engaging and informative content. My background in market analysis complements my work, allowing me to create content that resonates with audiences. I’m also a seasoned practitioner in the forex and crypto markets, with a strong foundation and deep interest in finance. My passion for the financial world drives me to produce content that is both insightful and valuable for those interested in understanding market trends and financial strategies.