Picture a market climbing steadily, confidence building with every green candle — and then, right at the top, a candle appears that looks almost identical to a bullish reversal signal. Except this time, it’s a warning. That candle is the hanging man, one of the more deceptive patterns in candlestick trading precisely because of how “normal” it looks at first glance.
“The hanging man doesn’t announce danger loudly. It disguises it inside a shape that usually means the opposite.”
In this guide, we’ll break down what the hanging man pattern actually represents, why it’s so easily confused with a bullish signal, how to confirm it properly, and how to trade it with discipline — all explained in plain, beginner-friendly language.
What Is a Hanging Man Candlestick Pattern?
A hanging man has the exact same structure as a hammer:
- A small body positioned near the top of the candle’s range
- A long lower wick, generally at least twice the length of the body
- Little to no upper wick
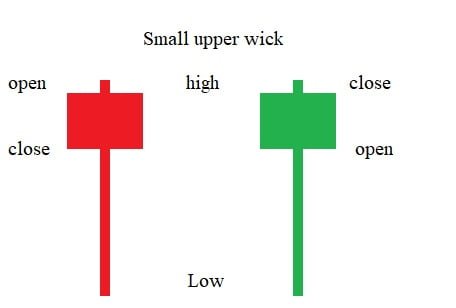
The only thing that separates a hanging man from a hammer is where it appears. When this shape forms after a sustained uptrend, it’s called a hanging man, and it carries a bearish implication rather than a bullish one.
“Same shape, opposite warning. Context is the only thing that tells them apart.”
Why the Hanging Man Is a Bearish Signal
At first glance, a long lower wick might seem like good news — it shows buyers stepped in and pushed price back up before the close. But think about what it actually reveals during an uptrend: sellers were suddenly strong enough to push price sharply lower within the session, even if buyers ultimately recovered most of that ground.
That’s the real warning. It shows that meaningful selling pressure has entered a market that, until that point, had seen very little resistance. Even though buyers “won” that particular candle, the fact that sellers could push so hard is often the first crack in an otherwise confident uptrend.
“It’s not the recovery that matters here. It’s the fact that a real sell-off was even possible in the first place.”
Hanging Man vs Hammer: How to Tell Them Apart
Because these two patterns are visually identical, the only reliable way to distinguish them is by checking the trend leading into the candle:
| Feature | Hammer | Hanging Man |
|---|---|---|
| Appears after | A downtrend | An uptrend |
| Typical bias | Bullish reversal | Bearish reversal warning |
| Shape | Identical | Identical |
| What it suggests | Buyers overpowering sellers | Sellers testing buyers’ resolve |

If you ever find yourself unsure whether a candle is a hammer or a hanging man, the fastest fix is to simply zoom out and look at the last several candles leading into it.
How Reliable Is the Hanging Man Pattern?
Like most single candlestick patterns, reliability depends heavily on context and confirmation. A hanging man is far more meaningful when:
- It forms after a long, extended uptrend that already looks stretched
- It appears near a previously tested resistance level or round number
- It’s accompanied by unusually high volume, suggesting genuine selling interest rather than random noise
- The next candle actually confirms the reversal by closing bearish
A hanging man appearing after only a short, weak uptrend — or without any nearby resistance — tends to carry far less predictive weight.
“A hanging man without confirmation is just a shape that happened to look scary.”
How to Trade a Hanging Man Candlestick
- Confirm you’re in a genuine, established uptrend before treating any candle as a potential hanging man.
- Check whether the pattern is forming near a meaningful resistance level, trendline, or round number.
- Compare the volume on the hanging man candle to recent bars — elevated volume adds credibility.
- Wait for the next candle to close bearish as confirmation before considering a short entry.
- Place your stop loss just above the high of the hanging man’s body (or the full candle, for a more conservative approach).
- Target the next visible support level or use a fixed risk-reward ratio.
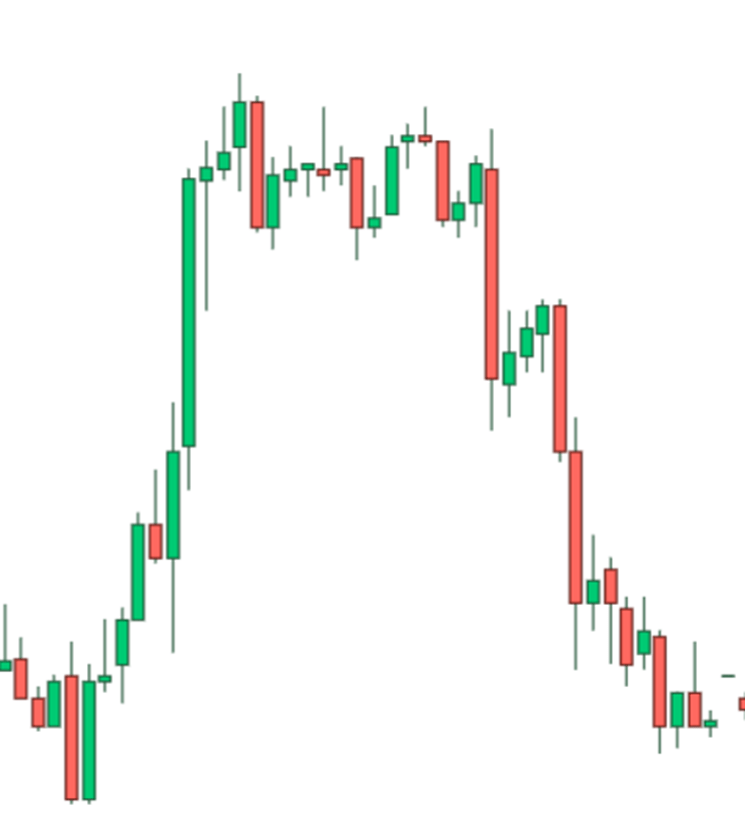
“The hanging man raises the question. The next candle answers it.”
Common Mistakes Traders Make With the Hanging Man
- Confusing it with a hammer, especially when scanning charts quickly without checking the broader trend.
- Acting immediately on the pattern without waiting for the next candle’s confirmation.
- Ignoring volume, missing the difference between a meaningful warning sign and ordinary market noise.
- Trading it in choppy, sideways markets, where the “uptrend” context needed for a valid hanging man doesn’t really exist.
- Setting stops too tight, getting stopped out by normal volatility before the actual reversal has a chance to develop.
Can a Hanging Man Pattern Fail?
Absolutely — and it fails more often than many beginners expect. Strong uptrends can absorb a hanging man completely, especially when driven by powerful buying momentum or a positive news catalyst. This is precisely why confirmation from the following candle isn’t optional; treating the hanging man as a guaranteed reversal, rather than a warning worth watching, is one of the most common ways traders lose money on this pattern.
“A warning sign is not a certainty. It’s a reason to pay closer attention, not a reason to panic-sell.”
Why Traders Often Overlook This Pattern
Because the hanging man looks so similar to a “positive” recovery candle at a glance, many beginners scroll right past it without registering the risk it represents. Ironically, this makes it one of the more useful patterns to train your eye for — precisely because it hides in a shape that most people instinctively read as bullish.
Final Thoughts
The hanging man candlestick pattern is a reminder that not every recovery within a candle is good news. When sellers can suddenly push price sharply lower during an uptrend — even if buyers manage to reclaim most of the ground by the close — it’s often the market’s first quiet hint that confidence is starting to crack.
“Learn to spot the hanging man, and uptrends stop feeling unstoppable the moment cracks start to show.”
Start by studying historical charts for this exact shape appearing after extended uptrends near resistance levels, and pay close attention to what happened in the candles that followed. That practice is what eventually turns this deceptively simple pattern into a genuinely useful early warning tool.

I’m Abdullah Shah, a content writer with three years of experience in crafting engaging and informative content. My background in market analysis complements my work, allowing me to create content that resonates with audiences. I’m also a seasoned practitioner in the forex and crypto markets, with a strong foundation and deep interest in finance. My passion for the financial world drives me to produce content that is both insightful and valuable for those interested in understanding market trends and financial strategies.