Table of Contents
In Inner Circle Trading (ICT) concepts, Michael J. Huddleston introduced a concept of volume imbalance. It is a subtle but a powerful concept that helps traders understand where institutional orders may have caused inefficiencies in price delivery.
These areas or zones are typically used by smart money traders to identify potential entry and reaction points. Price often reacts at these levels which indicate accumulation of orders. This article explores understanding of gaps and volume imbalance, high probability volume imbalances and trading with volume imbalance.
Understanding Gaps and Volume Imbalance
In trading, SMC and ICT trading methods are sensitive when it comes to gaps and volume imbalance. These are the key indicators of market inefficiencies. These concepts revolve around the key notion of ICT concepts that markets are driven by institutional order flow and constantly moving between states of efficiency and imbalance.
A gap represents a price area on a chart where little or no trading has occurred. In candlestick terms, it is an area between the closing price of one candlestick and the opening price of another candlestick. These gaps results from sharp price movements, low liquidity, and order imbalance. One of the formations of the gaps is known as Volume imbalance.
In ICT and SMC trading methods, there is a notion that market visits to these areas before continuing in its intended direction. Volume Imbalance represents an inefficient delivery of price. These inefficient zones often act as magnet for price.
Here, the underlying idea is that the market is driven by institutional algorithm and smart money. Price often returns to these areas to fill the gaps and rebalance order flow. Volume imbalance can either serve as a continuation or a reversal area. However, it is highly dependent on the broader context.
Identification of Volume Imbalance
Volume Imbalances are specific type of price inefficiency. These inefficiencies are not like traditional gaps. These gaps and imbalances are also found within live price action. It happens during rapid delivery phases.
These imbalances and zones are the areas where the buy and sell orders could not match efficiently. This leaves a void in the form of body-to-body gap between candlestick.
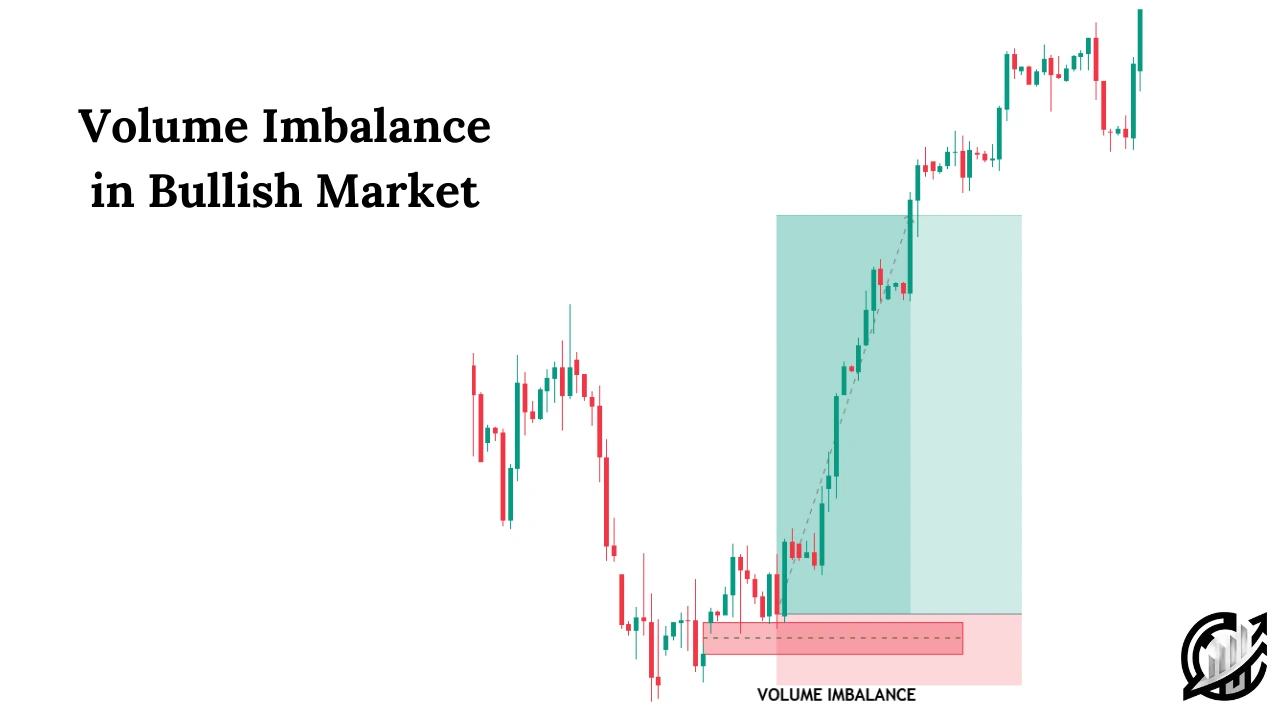
In order to identify a volume imbalance properly, we need to analyze two candles properly. Its formation is slightly different from the formation of fair value gap.

In Bullish scenario, first candlestick represents the price level before the impulse move begins. In this candlestick, we mark the close of the candle.
For a volume imbalance, the second candlestick opens higher than the previous candle’s close. We should mark the body-to-body gap.
The reverse case is applicable for Bearish. In bearish candlestick, we closely examine the close of bearish candlestick. For a volume imbalance, the second candlestick opens lower than the previous candlestick. There should be a visible body-to-body gap between the candlestick.
The key of volume imbalance is the gap between the bodies of first and second candlestick. There is a possibility that the wicks of the candlesticks may overlap, but the body-to-body separation defines the volume imbalance.
High and Low Probability Volume Imbalance
In the realm ICT Technical Science, understanding the context and confluence surrounding a price imbalance is crucial. While volume imbalances or other types of gaps may visually appear attractive, not all of them carry the same level of probability.
The key difference between high-probability and low-probability gaps lies in their alignment with the PD Array and other SMC tools.
High-Probability Volume Imbalance
A high-probability volume imbalance is one which is backed by supporting structures or elements from the PD array. These arrays usually include key tools like Order Blocks, Breaker Blocks, Fair Value Gaps, Liquidity pools etc.
When a volume imbalance aligns with these concepts, it implies that the imbalance is not just a random inefficiency, but a strategic zone where smart money has participated. This increases the weight of imbalance and increases the probability of volume imbalance.
A volume imbalance is considered as high probability when it is aligned with the PD array, supports the current or developing institutional order flow, aligned with market structure context, and lastly form in high volume session like London session and New York Trading session.
Low Probability Volume Imbalance
On the other side, a low probability volume imbalance exists in isolation. There is a notion that there has no significant supporting structure on its left-hand side or surrounding context.
If a gap appears in the middle of price action without nearby order blocks, FVGs o breaker block, then it is considered as weak and unlikely to hold importance for smart money traders.
Additionally, low probability gaps may simply be the result of retail-driven volatility, short-term liquidity hunts, or structural noise in the market. Acting on such gaps without confluence can lead to poor entries.
Trading with Volume Imbalance
In ICT trading methodology, trading is not about drawing lines and marking zones on chart. Similarly, it is not just about spotting FVG or order block on any random timeframe. Trading with ICT is all about building a complete narrative around market structure, liquidity, and institutional behavior.
To do this effectively, traders must incorporate higher timeframes bias, PD Array Confluence, and Market Structure Shift (MSS) across multiple timeframes. A wise ICT trader uses these concepts together to filter out weak setups and enhance trade accuracy in both bullish and bearish conditions.
Timeframe Selection and Alignment
The first and most influential concept is understanding multiple timeframes and their alignment. This involves using a top-down approach where you begin your analysis from higher timeframes. This allows us to understand broader market context and structure.
Analysis often starts from higher timeframes like weekly, daily and 4-hour. Once the HTF bias is set then traders shift to lower timeframes like 15-min, 5-min, or even 1-min charts to find entry confirmations in the form of LTF BOS or MSS, displacement and entries around imbalances.
PD Array Confluence
The PD Array provides structural confluence for your entries. When multiple elements of ICT and SMC concepts align with your higher timeframe structure and directional bias, the setup becomes high probability.
For example, a bullish FVG that sits above a bullish OB inside a discount zone offers triple confluence: it shows inefficiency, institutional interest and discount pricing. This stacked alignment gives you a precise zone to wait for price action confirmation like change of character (CHOCH) or market structure shift.
Confirmation of Intent
Lastly, we look for MSS as a key confirmation tool in ICT Trading. It simply presents a transition in control. This is considered as a transition from sellers to buyers (in bullish case) or from buyers to sellers in bearish scenario. MSS is often used to avoid premature entries.
An HTF bullish bias paired with LTF bullish MSS tells traders that the market is transitioning into a delivery phase and is ready to move in their intended direction. Look at the example:

Here, in the example things are more visually appealing. Here we have everything in a single timeframe. We have a clearly visible volume imbalance and then a shift in market structure. This also implies that LTF shift in market structure is also aligned with higher timeframes bias.
Similarly, a LTF bearish bias paired with LTF bearish MSS tells traders that the market is transitioning from bullish to bearish and is ready to move in their intended direction. Look at the example:

For consistently high-qualifying trades, traders must align all the technical SMC and ICT tools for better and mature trade entries and exits. These concepts works across all market conditions, and provides structured and disciplined framework for navigating the forex market like smart money.
Final Note
The concepts discussed in this article are designed to enhance trading precision. However, it never guarantees success in trading. All trading involves risk, and past performance is not indicative of future results, It is advised that traders should always perform their own analysis, use proper risk management strategies, and never risk more than they afford to lose.
These are all educational insights and can be used for informational purposes. Never consider it as a financial advice. Always test strategies in a demo environment before applying them to live market.
FAQs
What is a Volume Imbalance in ICT methodology?
A volume imbalance refers to a body-to-body gap between candlestick caused by sudden price move where buy and sell orders were not fully matched. It reflects a temporary inefficiency in the market that price may return to for rebalancing.
How to identify a Volume Imbalance?
We should closely pay attention to body-to-body gap between two candlesticks. In a bullish scenario, the closing price of the first candlestick is below the opening price the second candlestick. Wicks may overlap but the gap defines the imbalance.
Is wick-to-wick gap required for a volume imbalance?
No, in a volume imbalance, wick-to-wick gaps are not required. The key focus is on the body-to-body gap between the first and the second candlestick. However, If both body and wick gaps exist, it may be categorized as vacuum gap.

I’m Aatiq Shah, a dedicated forex and crypto market practitioner with three years of hands-on experience. Currently, I’m working as a Financial Manager. My journey in the world of finance has equipped me with the skills and knowledge needed to navigate the complexities of the forex and crypto markets.


