Table of Contents
Technical analysis has evolved with the passage of time. From traditional to modern, the foundation of technical analysis remains the same. In traditional retail trading, Open, High, Low and Close (OHLC) are used to build candlesticks and bar charts.
With the evolution of SMC and ICT trading methods, these four pieces become much more than simple reference points. Open High Low and Close are liquidity magnets, manipulation zones, and institutional reference points.
This article explores the OHLC in trading and how it can be used to craft trading strategy in both bullish and bearish market using SMC trading concepts.
Open High Low and Close (OHLC)
In general, OHLC stands for Open, High, Low, and Close. These are the four major price points candlestick and bar chart used to represent a specific timeframe. The time can be minute, hour, day, week, or month. These price points are the core aspect of price chart and trading analysis.
If you closely examine the candlestick chart or bar chart, these values are visualized which helps traders analyzed the price behavior. By combining trading strategies like SMC and ICT, you can make predictions about the future price movements.
OHLC and Market Structure
As we are referring to SMC and ICT trading concepts, market structure is the foundation of everything. In SMC trading, market structure shift is always seen through the lens of higher highs, lower lows, and the closing behavior of candles. However, OHLC defines how structure is formed and broken.
Highs and Lows are often used to set liquidity pools. The Open and Close defines candle momentum. Strong price momentum can signal displacement of price. A Strong close above or below the previous high or low can refer to as break of structure or change of character.
One important thing is that you should care about liquidity sweeps. If price creates a wick and close below the previous high or above the previous low, there is possibility of liquidity sweep. In order to confirm this, we should be look for MSS in opposite direction.
Lastly, in OHLC, timeframe selection is crucial. Single candlesticks’ high and low are important only if you are using higher time like monthly, weekly, daily, and in some cases, 4-hour. For example, if you are using ICT for technical analysis, you must mark the highs and lows of weekly, and daily candle for analysis.
Open Price in OHLC
In ICT’s teaching, the opening price is considered as critical reference point. Like I said earlier, the opening of daily and weekly are considered as the most important price point.
Like if we take the daily open as reference point, it helps us building daily bias for trading. If price trade above it during London session or New York session, the bullish sentiment is favored. Conversely, if price trades below it, bearish bias may be assumed.
There are many ICT trading strategies that are built on how price behaves around the daily open, especially during ICT kill zones. Opening gaps are from previous closes are viewed inefficiencies or FVGs. In SMC, the open may also align with the 50% equilibrium of higher timeframe ranges. This range is used to identify premium and discount zones for trade setup entries.
Highs and Lows in OHLC
In smart money trading, highs and lows are not random. They are engineered for liquidity traps. According to Micheal, Interbank Price Delivery Algorithm (IPDA) moves the price.
Highs and lows of previous HTF candle is often seen as a liquidity pool where buy stops and sell stops are resting. Now there is an important thing to note. Market is fractal. That is the reason we use 4-hour and 2-hour candle’s highs and lows as reference points. In candle range theory (CRT), we mark high and low of previous candle as reference liquidity level.
Smart money often drives the price higher in order to sweep buy-side and sell-side liquidity. The sweep of buy side and sell side liquidity is often seen as preparation of bearish and bullish setups, especially when followed by CHOCH and FVG.
These highs and Lows help from inducement zones. This is an essential element in identifying smart money entry pattern.
Closing Price in OHLC
As we said opening price of a candlestick represents bias, the closing price often confirms it. In ICT’s view, the close above a previous high, especially on higher timeframes, can mean the following: the previous buy-side liquidity has been taken, and institutions may be closing long positions. There is also a possibility of a reversal.
In SMC, a strong displacement candle, also known as institutional funding candle with trend confirmation, with a close through structure often validates a break of structure. Here comes an important point which cannot be neglected. If it lacks a strong close, it is treated as a liquidity grab. A structural break with cannot be considered as market structure shift.
In OHLC, the close is often used to confirm bias and helps in building order blocks, breaker blocks, and FVGs.
OHLC as Algorithmic Price Delivery Anchors
Michael teaches that algorithms use time and price as the delivery mechanism. Open, High, Low and Close (OHLC) provides traders the price anchors, while kill zones provide time anchors.
Smart money uses OHLC as reference points for liquidity manipulation. High and low are critical points in a candlestick. High to low range shows price efficiency and inefficiency. Its combinations with volume strengthen and confirm technical analysis.
That is the reason ICT often emphasizes on how price reacts at OHLC levels across multiple sessions and timeframes. As he believed that these reactions are not noise or random, but coded behavior from smart money algorithms.
Final Note
In modern trading, it is crucial to understand open, high, low and close in trading through the lens of smart money concepts. Almost all traders use the data in trading, but ICT goes beyond the traditional use of OHLC for candlestick interpretation. It opens the door to traders where every candlestick is a message from the institutions. Financial Markets carries risk. Trading in the market can lead to potential losses. Whether you are trading crypto, forex, commodities, or Gold, understand the risk. Lastly, never trade with the capital that you cannot afford to lose.
What is OHLC in Trading?
In trading, O represents opening price, H represents high, L represents low, and C represents close of price within specific session.
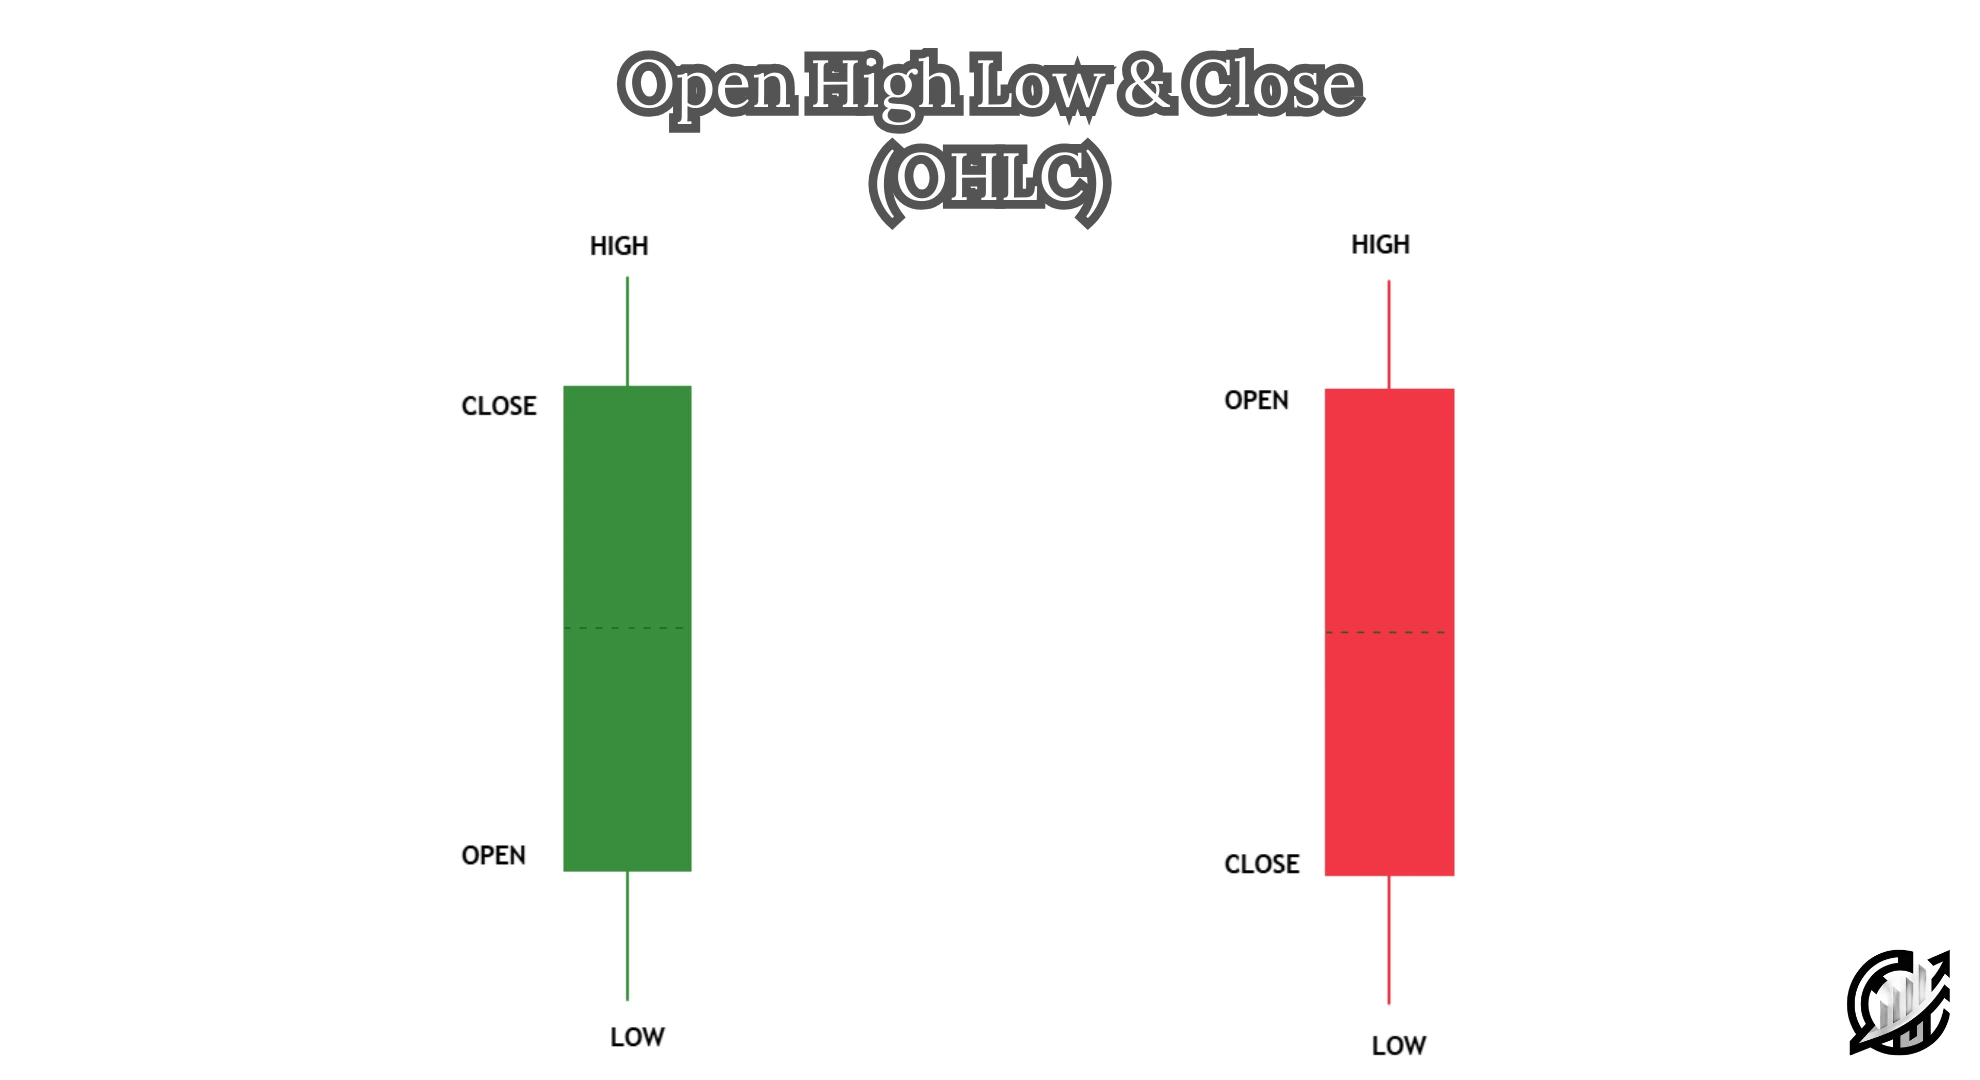
How OHLC forms Candlestick?
Each and every candlestick on a chart is formed using OHLC data. When candlestick open, it is where price starts. Close where price ends in a session. High is the top wick of the candlestick. Lastly, low is the bottom wick in the candle.
There are two main types of candlesticks based on market conditions: bullish and bearish candlesticks. Bullish candlestick close higher than its open, while bearish candle close lower than its open.
How traders can use OHLC data in trading?
Mastering markets is an art. There is not an exact science for market. Similarly, if your want to use OHLC data, the best way is to combine with SMC and ICT trading methods.
Traders can use the data to confirm trends because there is a notion that closing price confirms trends. Lastly, it can be combined with volume spread analysis to find strength and weaknesses in market.
Are OHLC charts suitable for all markets?
Yes, the data is used in all markets to understand price behavior across all timeframes.

I’m Aatiq Shah, a dedicated forex and crypto market practitioner with three years of hands-on experience. Currently, I’m working as a Financial Manager. My journey in the world of finance has equipped me with the skills and knowledge needed to navigate the complexities of the forex and crypto markets.