In the realm of technical analysis, not all concept delivers the anticipated results. That is the reason few concepts carry as much practical weight as swing high and swing low trading.
Whether you are analyzing stocks, commodities, or forex pairs, structure mapping is crucial. Marking swing high and swing in structure mapping is the crucial step. Valid swing high and swing are not just random price points but backbone of every chart analysis.
As we said understanding swing high and swing low in trading is the first step towards reading market structure. From identifying trends and placing SL & TP to spotting reversal zones, these two concepts are embedded in virtually every trading strategy.

Table of Contents
Meaning & Definition of Swing High and Swing Low
Swing High
A swing high is defined as price point on a chart where the market rises to a peak and then begins to decline. In technical terms, swing high refers to a candle or price bar whose high is greater than the highs of the candles surrounding it on both sides.
For a swing high to be valid, it should be confirmed by subsequent price action. Price should move lower after reaching the swing high. Swing highs can act as resistance levels. When the price returns to this level, it may struggle to break above it.
Swing Low
A swing low is defined as a lowest price point in a price move before the market reverses upward. In technical terms, the swing low refers to a candle or bar whose low is lower than the lows of the surrounding candles on both sides.
For a swing low to be valid, it should be confirmed by the next move. It means that price must move higher after reaching the swing low. Swing low can act as a support level. When price returns to the level, it is the possibility that price will struggle to break below it.
We also look for other ICT confirmations. A swing high and low are formed after a break of structure. Change of character changes the direction of the market.

Formation of Swing Low
Formation of the swing low takes place through the following steps:
- Price begins to decline from a higher level. This temporary decline is also known as corrective phase in an uptrend.
- The price continues to drop until it reaches a point where it starts to stabilize or reverse direction.
- To be considered a valid swing low, this trough must be surrounded by higher prices on both sides. In other words, the price at the swing low should be lower than the prices just before and after it.
- After reaching the swing low, the price begins to rise. This upward movement indicates that the market might be reversing or experiencing buying interest at this level.
- Crossing the previous swing high results in Break of structure (BOS) and results in a new impulse move and continuation of the trend.
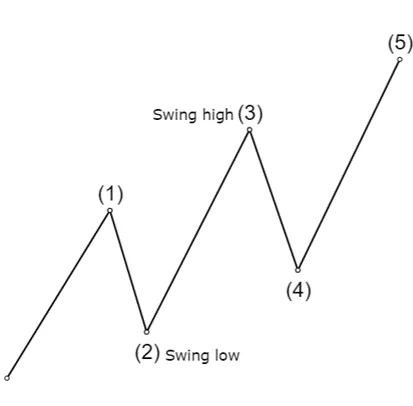
The formation of swing low is the almost same but the difference is that the continuation of trend and break of structure in swing low and short-term corrective phase high is considered as swing high.
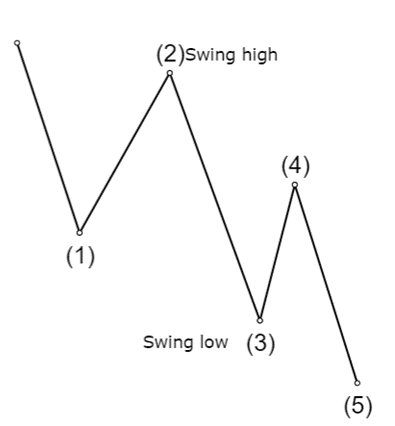
Candlestick Identification of Swing low
In candlestick identification of swing low, a trader performs the following steps:
- First step includes the identification of the lowest point in the current price range. The low of the candle should be lower than the lows of the surrounding candle.
- Check and compare the low of the candlestick with previous candlesticks. The low of the candlestick must be lower than the previous candlesticks.
- Check and compare the low of the candlestick with subsequent candlestick. The candlesticks do not cross the low of the lower candle.
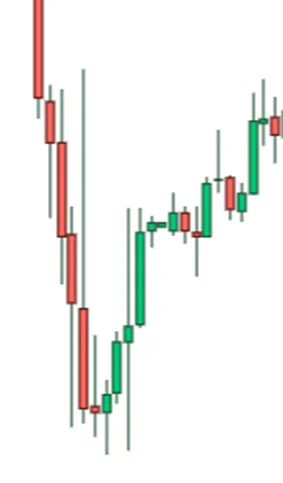
By following these steps, you can accurately identify swing lows and make informed trading decisions based on market trends and price action.
Formation of Swing High
Formation of swing high takes place through the following steps:
- After creating a lower low in corrective phase, price begins to rise from the lower level. This results in upward movement.
- The price begins to rise from a lower level, creating an upward movement. This rise should be significant enough to form a noticeable peak or high point in the chart.
- To be considered a valid swing high, this peak must be surrounded by lower prices on both sides. In other words, the price at the swing high should be higher than the prices just before and after it.
- After reaching the swing high, the price begins to decline. This downward movement indicates that the market might be reversing or experiencing selling pressure at this level.
- Break of structure results in a new swing high and continuation of the trend.
Candlestick identification of Swing high
To identify a swing high using candlesticks, you need to observe specific candlestick patterns and price action that indicate the peak has likely formed and a reversal is occurring. In candlestick identification, a trader performs the following tasks:
- Look for a candlestick that has reached a higher price level compared to the preceding candlesticks. This candlestick’s high should be the highest point in the recent price action.
- The candlestick immediately following the identified high should have a lower high. This indicates that the upward momentum is slowing down. The candlestick immediately preceding the identified high should have a lower high as well, establishing that the identified candlestick is the highest point (local maximum) in that sequence.
- Subsequent candlestick do not cross the high of the swing high candle and close lower than the swing high candle.
What Make a Swing high and Low Valid?
Not all price peaks and lows qualify as valid and meaningful. Identification of valid swing high and swing low helps avoid false signals. A valid swing high must meet these criteria:
- The price peak must be surrounded by lower highs on both sides.
- The swing must represent a clear and meaningful reversal, not just a minor fluctuation within a tight consolidation zone.
- Ideally, reversal candle should show a clear rejection sign.
- The swing should fit the broader trend context.
Similarly, a valid swing low requires the trough to be surrounded by higher lows on both sides, with clear evidence of bullish rejection. If price moves sideways in tight chop with no directional follow-through, those small fluctuations are noise, not genuine swings.
ICT & SMC context of Swing high and swing low
One of the major concepts of ICT is the analysis of market structure. Swing highs and swing lows are analyzed to understand overall market structure and potential trading opportunities.
- In ICT, swing highs help determine the market’s supply levels (order blocks) in a downtrend and the current trend’s strength. In an uptrend, higher swing highs indicate that the market is bullish and shows strength. Conversely, a failure to create new swing highs might signal a weakening trend or potential reversal.
- Swings lows are important because it helps in identifying potential order block during an uptrend. In a downtrend, lower swing lows suggest a bearish market. A failure to create new swing lows can indicate a weakening downtrend or a potential trend reversal.
- ICT traders pay attention to swing highs and lows to identify potential liquidity pools.
- These are levels where ICT trader look for market manipulation and false breakouts. Proper recognition of the false breakouts can help traders avoid getting trapped.
- Use of the swing highs and lows helps trader to map out price action and analyze the footprints of institutional traders.
Traders often make mistakes and use the foundational concepts alone. A trading decision must be filtered from various aspects.
Swing High and Low Liquidity
One of the most least discussed aspect of swing points is their relationship to market liquidity. Swing high and swing low liquidity refers to the pools of pending orders that naturally accumulate around these price levels.
When swing low forms, retail traders who enters long positions immediately place their stop-loss orders just below that low. This creates clusters of sell orders beneath the swing low. This is also known as sell-side liquidity (SSL).
Conversely, when a swing high forms, traders place short positions and place their stop-loss orders just above that swing high. This creates a pool of buy orders above the swing high.
Institutional traders and algorithmic systems are fully aware of where these stop clusters reside. When large institutions need to execute a substantial position, it requires liquidity. This is why markets frequently sweep a swing high or swing low.
Examples
Below the image shows how major swing highs and lows form in a downtrend market:
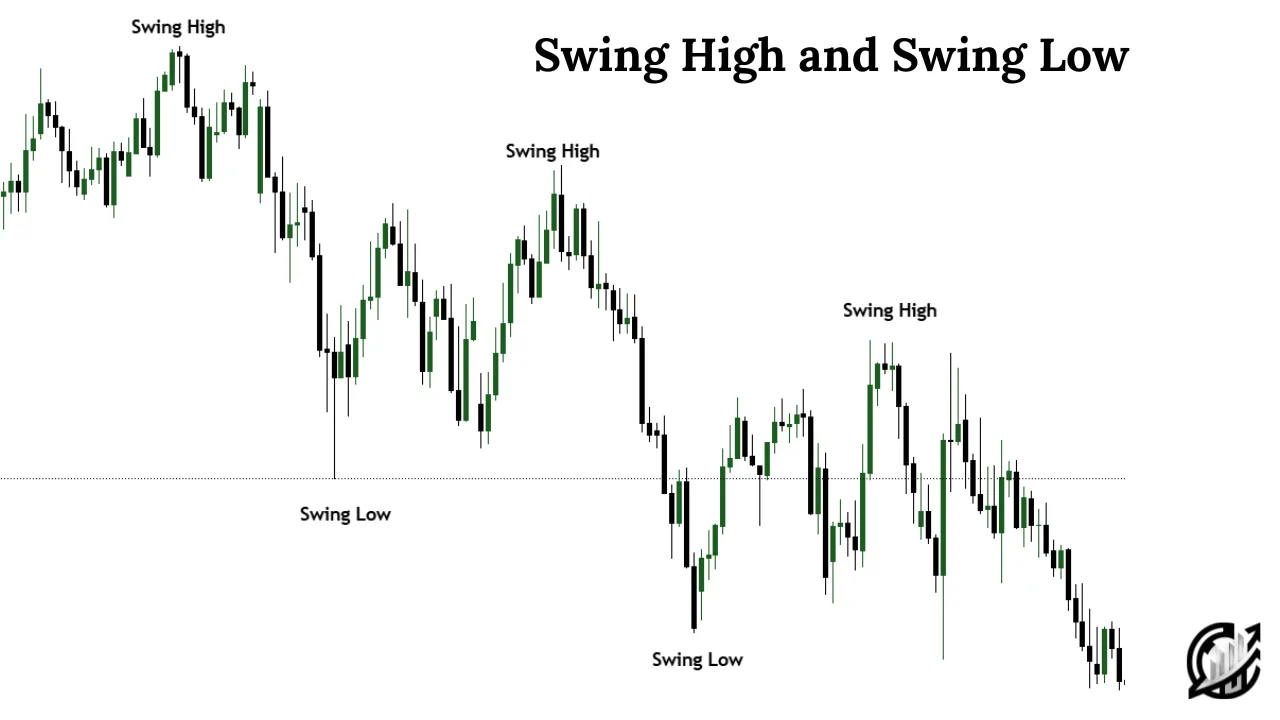
Final Note
Trading involves significant risk and may not be suitable for all investors. Swing highs and lows provide insights into market trends and potential opportunities but should not be solely relied upon for decision-making. Always perform thorough research and consider your financial situation and risk tolerance before trading. Seek professional advice if necessary. Remember, past performance is not indicative of future results.
Frequently Asked Questions (FAQs)
What is a Swing High?
A swing high is a peak in the price chart where the price reaches a high point and then begins to decline. It is identified by comparing the high of a specific candlestick to the highs of the surrounding candlesticks, which should be lower.
What is a Swing Low?
A swing low is a trough in the price chart where the price reaches a low point and then begins to rise. It is identified by comparing the low of a specific candlestick to the lows of the surrounding candlesticks, which should be higher.
Why are Swing Highs and Swing Lows important in trading?
Swing highs and swing lows are critical for understanding market trends, identifying support and resistance levels, and making informed trading decisions. They help traders determine entry and exit points, as well as set stop-loss orders.

I’m Abdullah Shah, a content writer with three years of experience in crafting engaging and informative content. My background in market analysis complements my work, allowing me to create content that resonates with audiences. I’m also a seasoned practitioner in the forex and crypto markets, with a strong foundation and deep interest in finance. My passion for the financial world drives me to produce content that is both insightful and valuable for those interested in understanding market trends and financial strategies.