Table of Contents
Market manipulation costs retail traders. They often stop out when market manipulates in specific areas. Liquidity, in forex and other financial markets, fuels the movement of price. Candle range theory (CRT) and ICT power of 3 is combined to bring more sophisticated results. Traders believe that the focus should be on the grabbed liquidity rather than on any specific theory. Just like forex, manipulation is quite common in cryptocurrencies.
CRT is a concept used in technical and price action analysis of financial markets. The theory focuses on analyzing the range of candlestick bodies on different timeframe. The theory can be combined with SMC and ICT trading concepts to bring more energy in trading decisions.
Understanding Candle Range Theory (CRT)
Range of candlestick refers to the distance its high and low. From smaller time frames to higher timeframe the rule remains the same for identifying the range of a candlestick. Each candlestick presents four key points: open, high, low and close. The distance between open and close is the body of the candle. Wicks (shadows) represents market dynamics.
Candle Range Theory (CRT) is a powerful approach and helps in understanding market dynamics. The theory operates on the principle that every candlestick is a representation of a range of price action. We can say that a candlestick in a higher timeframe is a range of price action in lower timeframe. When we analyze the HTF candle closely in lower time frame, there is a clear range of price action between the highest and lowest of the HTF candlestick.
Price does not move randomly within these ranges. Price movement is structured and can follow certain market behavior. The price can sweep, break out or retest these ranges. Such behavior is seen in candlestick patterns. These candlesticks provide deeper information of market sentiment. The way market moves within the ranges informs traders about the market’s intention to accumulate, manipulate or distribute. From there we collect probabilities and predict the next move of the market.

The range is not static. Ranges of HTF in LTF can vary. However, in order to catch more logical trade. There should be proper accumulation, manipulation and distribution. Normal ranges are less predictive in nature. That is why, its combination with ICT power of 3 makes it powerful.
Price movement and ICT Power of 3 (AMD)
A foundational factor in CRT is its combination with ICT power of 3. With the help of this, a trader can time trade entries in market. Traders using the model (combined with ICT power of three) firmly believes that market mainly moves in three directions: Accumulation, manipulation and distribution. Above chart is showing the whole price action range within one candle. It can happen multiple candlesticks.
There is a rule in the model that if market decides to move in a direction, it must accumulate and then clear out the highs or lows of the reference candlestick (it depends upon whether the candle is bullish or bearish).
After identification of candlestick with strong range in key level. There is a proper accumulation on smaller time frame. Institutions accumulate their positions. During accumulation phase, market move in a tight range (sideways). Institutions carefully accumulate positions with intention of erasing foot prints of their accumulation.
Manipulation occurs to trap retailers. Retailer enter in market with break out. Institutions uses the breakout as a trap and short lived. Manipulation occurs in characterized by false breakouts, stop hunts, or liquidity grabs.
Manipulation is short-lived and market enter again in the range. Distribution phase usually aligns with the actual trend direction. It allows market to move in one specific direction. The phase is profitable for institutional investors.
The entire process is considered as a heart beat of the market. The process of ADM operates as a never-ending loop in financial markets. The process repeats across multiple timeframes. By zooming into the smaller timeframes, we can identify accumulation, manipulation and distribution of HTF CTR candlestick. Multi-timeframes help in refining the entry and exit points.
Identification of CTR Candlestick
CRT revolves around the idea that each candlestick on a chart represents a range of price action. The range can be influenced by employing various other factors by looking at smaller timeframe. The additional components can help us in identifying CRT.
Look for CRT around Key levels:
One of the important levels of chart is supply and demand zones. These are the key psychological levels where price strongly reacts. In ICT trading, the favorable condition would be if there is an order block. Following are the key levels that should be considered in smaller time frames:
- Order Blocks and Point of interest
- Fair value gaps and liquidity voids
- Previous swing highs and lows
- Break of Structure and change of character.
There are the few thing that trader can look for while trading.
Look for Candles inside the range
After identifying CRTs around key levels, the next step is look for candles inside the CRT. Candles inside the range provide important clues about the current phase.
Inside candle forms when its high and low forms within the previous candle. In candlestick patterns, such formation is known as Harami pattern. Inside candles signals a period of consolidation. In this period market is accumulating orders. Accumulation is often seen as a series of smaller candles that stays within the defined range.
Manipulation occurs when market moves outside the established range. Such move is designed to capture the stoploss of retail traders. Manipulation candles often have long wicks. These candles form around key levels. ICT traders are aware about fake outs. This serves as additional confirmation of trend direction.
Distribution candles are displacement candles (candles with large bodies) that break out of the range. These candles mark the start of the trend or continuation of the move after manipulation phase. Distribution candles are often seen during the most volatile part of the trading day where institutions are actively participating in the market.
LTF CRT within a HTF CRT
One of the most important things is the concept of multi-timeframe analysis. A candle range patterns that forms on a higher timeframe can often contain several smaller versions within smaller timeframes.
On a higher timeframe, a daily candle forms a range between its high and low. The range of the candle becomes the CRT for the day. When we zoom by approaching smaller timeframe, there are number of candles representing price action throughout the day. Within the range, we can spot lower timeframe CRTs. Lower timeframe like 1-hour and 15 min is used to time trading entry in the market.
This multi-timeframe approach allows traders to understand the bigger picture of the market. The bigger picture allows traders to confirm trade and avoid false signals.
CRTs around Key Sessions
Timing is crucial in candle range theory. It is because within an impulse or correction move, there are numerous candles with strong ranges. This makes it difficult for us to identify right candle range pattern. There are key trading sessions and kill zones that help us to identify the right candle range pattern. Asian, London, and New York sessions are the most important trading period in the forex market.
Asian session has low volatility and is often characterized by accumulation. Market during Asian session moves sideways or within a range during a session. It forms accumulation phase of CRT. London session open with a burst of volatility, often leading to manipulation. Price may break out of the range formed during the Asian session. This manipulation results in triggering of stop loss trigger of retail traders or enticing retail traders into false break outs. New York session typically sees the highest volatility. This is the distribution phase where institutions distribute their positions.
Key timing for CRTs
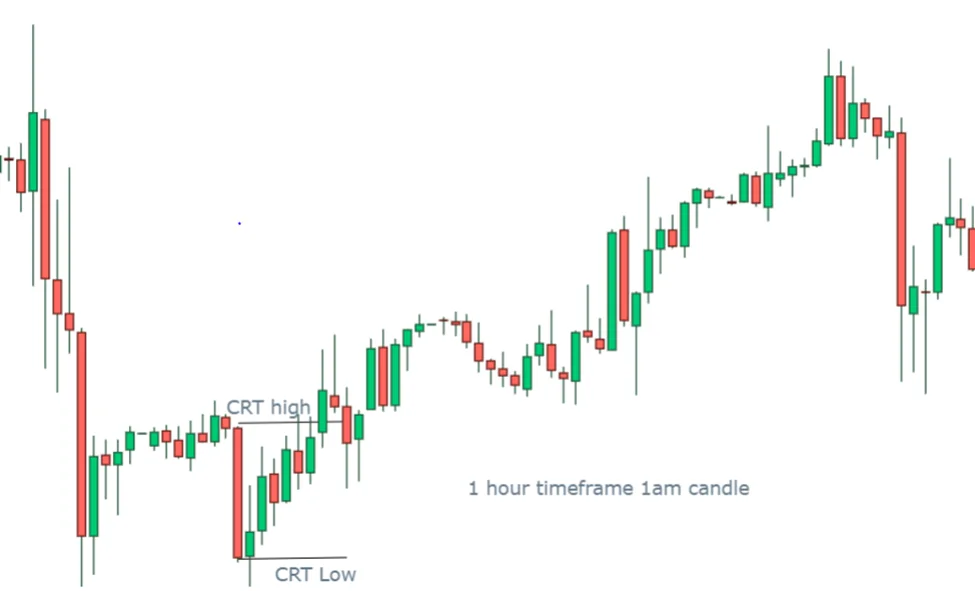
In trading CRT, timing and Key levels are most important levels. Identification of candlestick according to this model in forex market provide an edge in spotting accumulation, manipulation and distribution phases. 1am, 5am, 9am 1pm, 3pm, 9pm, are key times when liquidity and volatility shift due to major market session overlaps.
1am and 5am coincide with the Asian and London Session overlap. During this time, price often transitions from the lower volatility of the Asian session into the higher volatility of the London session. Traders often expects manipulation or break out.
9am is the time when the London session is fully underway. This time is important because significant price movement occurs.
1pm and 3pm are crucial. In this time New York session comes into play. Overlap between London and New York session results in volatility. Identification of CRT during these timings can provide great trading opportunities.
9pm is the time when New York session ends volatility decreases. CRT patterns around this time indicate final movement of the day.
Candle Range Theory and Multi-timeframe Analysis
The concept of multi-timeframe analysis plays a critical role in refining trading decisions and locating sniper entries. The ideas is to use HTF CRT for context and then zoom into a lower timeframe for precise entry points. This allows traders to align with the overall trend or momentum. The following is timeframe combination used in CRT trading:
- Trace monthly CRT for context and take entry on daily candle setup.
- Tracing daily CRT for context and taking entry on 1-hour candle setup.
- Tracing CRT on 4-hour chart and taking entry on 15-min timeframe.
- Tracing CRT on 1-hour chart and taking entry on 5min chart.
- Tracing CRT on 15 min chart and taking entry on 1min chart.
The essence of multi-timeframe analysis lies in using higher timeframe for context and then using smaller timeframes for trading setup. Multi-timeframe analysis helps in understanding overall structure of the market. ICT PD arrays are used in combination with CRT for better technical analysis.

CRT Bullish Model
In bullish institutional order flow, CRT model helps traders identify potential bullish reversal at key levels. This model works extremely well when combined with higher-timeframe market analysis, liquidity concepts, and market structure notions.
A bullish CRT model begins only when price is trading at or near a higher-timeframe liquidity zone or order block. Such zones and order blocks act as the foundation for the setup.
The formation starts with a candlestick that closes directly at the liquidity zone or order block. This candle became the reference candle. The high and low of the candle forms the initial range a trader must monitor. Marking the high and low is important because the next price action will interact with this range to reveal the intentions of smart money.
After the establishment of the reference candle, the next candle sweeps the low of the previous candle. The notion is that smart money drives the price lower for liquidity. However, its close must be above the low of the reference candlestick. This indicates that the downside move was not genuine bearish continuation.
At this stage, you should be clear about the basic structure of CRT model.
After the liquidity grab, you need bullish confirmation. The candle must close above the high of the candle that performed the liquidity raid. This signals a shift in order flow.
Trading with Bullish CRT
Above is a simple interpretation of Bullish CRT model, it is important to note that entry conditions are different for each trader. You can use SMC price action concepts to plan entry in the market. Usually, traders consider the two primary entry techniques.
First is candlestick confirmation entry. Some CRT traders prefer to enter after the candle close above the high of the raid candle. This is a straightforward confirmation-based entry.
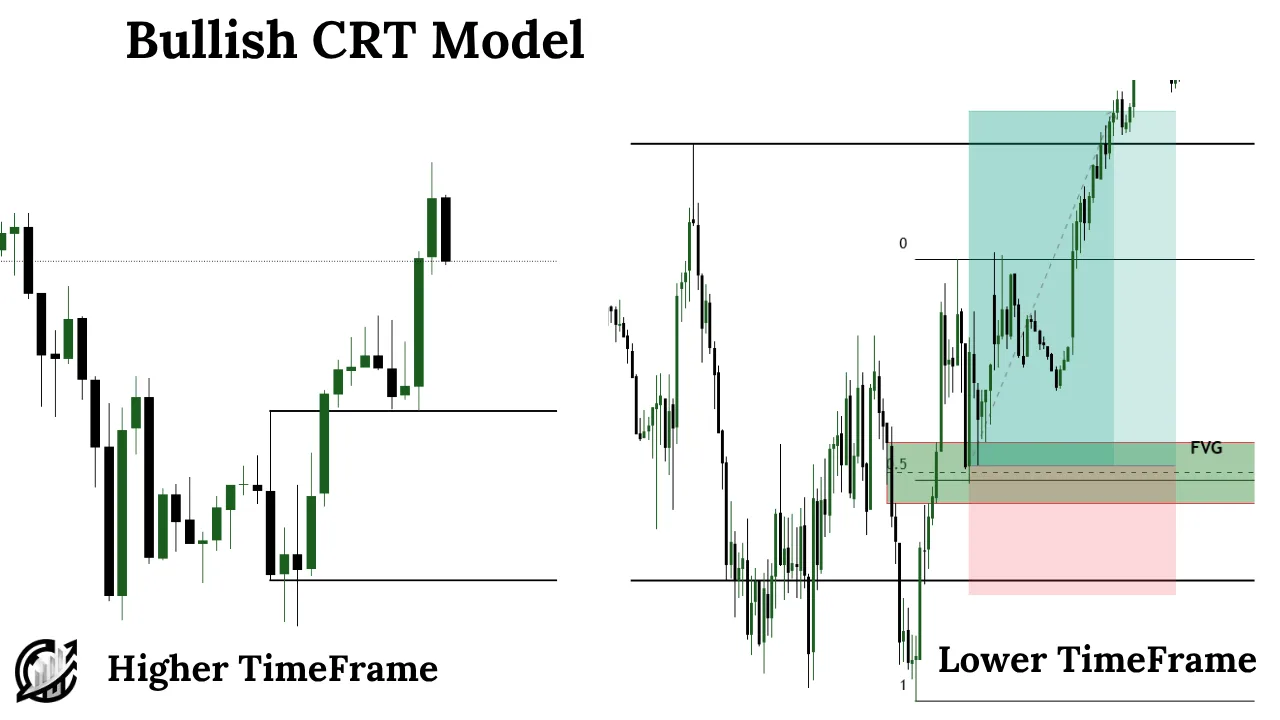
Second is ICT market structure shift. It is the most preferred method of trade entry. With this in trading arsenal, it is important to refine the entry using a lower timeframe (M1-M5). Look at the chart for an ICT style MSS. Once market confirms bullish structure shift, execute on the retest of the displaced level or a small fair value gap.
CRT Bearish Model
A bearish CRT model begins only when price is trading at or near a higher-timeframe liquidity zone or order block. These zones and order blocks are the foundation of the trading setup.
Its formation begins with a candlestick that closes near its important swing points and liquidity levels. Here forms the first candle, also known as reference candle. Mark its high and low because the upcoming price action reveals the true intention of smart money.
After the establishment of the reference candle, the next candle sweeps the high of the previous candle. The notion is that smart money drives the price higher for liquidity. However, its close must be below the high of the reference candlestick. This indicates that the upside move was not genuine bullish continuation.
At this stage, you should be clear about the basic structure of CRT model.
After the liquidity grab, you need bearish confirmation. The candle must close below the low of the candle that performed the liquidity raid. This signals a shift in order flow.
Trading with Bearish CRT
Above is a simple interpretation of bearish CRT model, it is important to note that entry conditions are different for each trader. Usually, traders consider the two primary entry techniques.
First is candlestick confirmation entry. Some CRT traders prefer to enter after the candle close below the low of the raid candle. This is a straightforward confirmation-based entry.
Second is ICT market structure shift. It is the most preferred method of trade entry. With this in trading arsenal, it is important to refine the entry using a lower timeframe (M1-M5). Look for an ICT style MSS. Once market confirms bearish structure shift, execute on the retest of the displaced level or a small fair value gap.
Final Note
Candle Range Theory is an important concept in trading realm. Combining ICT with CRT enhances technical analysis and the ability to predict market movement. Always ensure that you analysis is aligned with higher timeframe. Trading involves substantial risk and may not be suitable for all investors. Always use risk management strategies and never trade with money you cannot afford to lose.
Frequently Asked Questions (FAQs)
What is Candle Range Theory?
Candle Range Theory (CRT) views each candlestick as a range of price action. The high and low of the candle represent the range of price action on smaller timeframe. It shows how the market moves within and around these ranges on various timeframes.
How to identify Candle Ranges?
The best idea is to look around key levels like ICT PD arrays, supply and demand zone, and recent swing highs and lows.
What are the essential timings for CRT?
1am, 5am, 9am 1pm, 3pm, 9pm, are the essential timings when liquidity and volatility shift due to major market session overlaps.
What timeframes to use for CRT entry?
A common multi-timeframe CRT approach includes:
Monthly CRT → Entry on Daily setups.
Daily CRT → Entry on 1-hour setups.
4-hour CRT → Entry on 15-minute setups.
1-hour CRT → Entry on 5-minute setups.
15-minute CRT → Entry on 1-minute setups.

I’m Aatiq Shah, a dedicated forex and crypto market practitioner with three years of hands-on experience. Currently, I’m working as a Financial Manager. My journey in the world of finance has equipped me with the skills and knowledge needed to navigate the complexities of the forex and crypto markets.